Fig. 5.
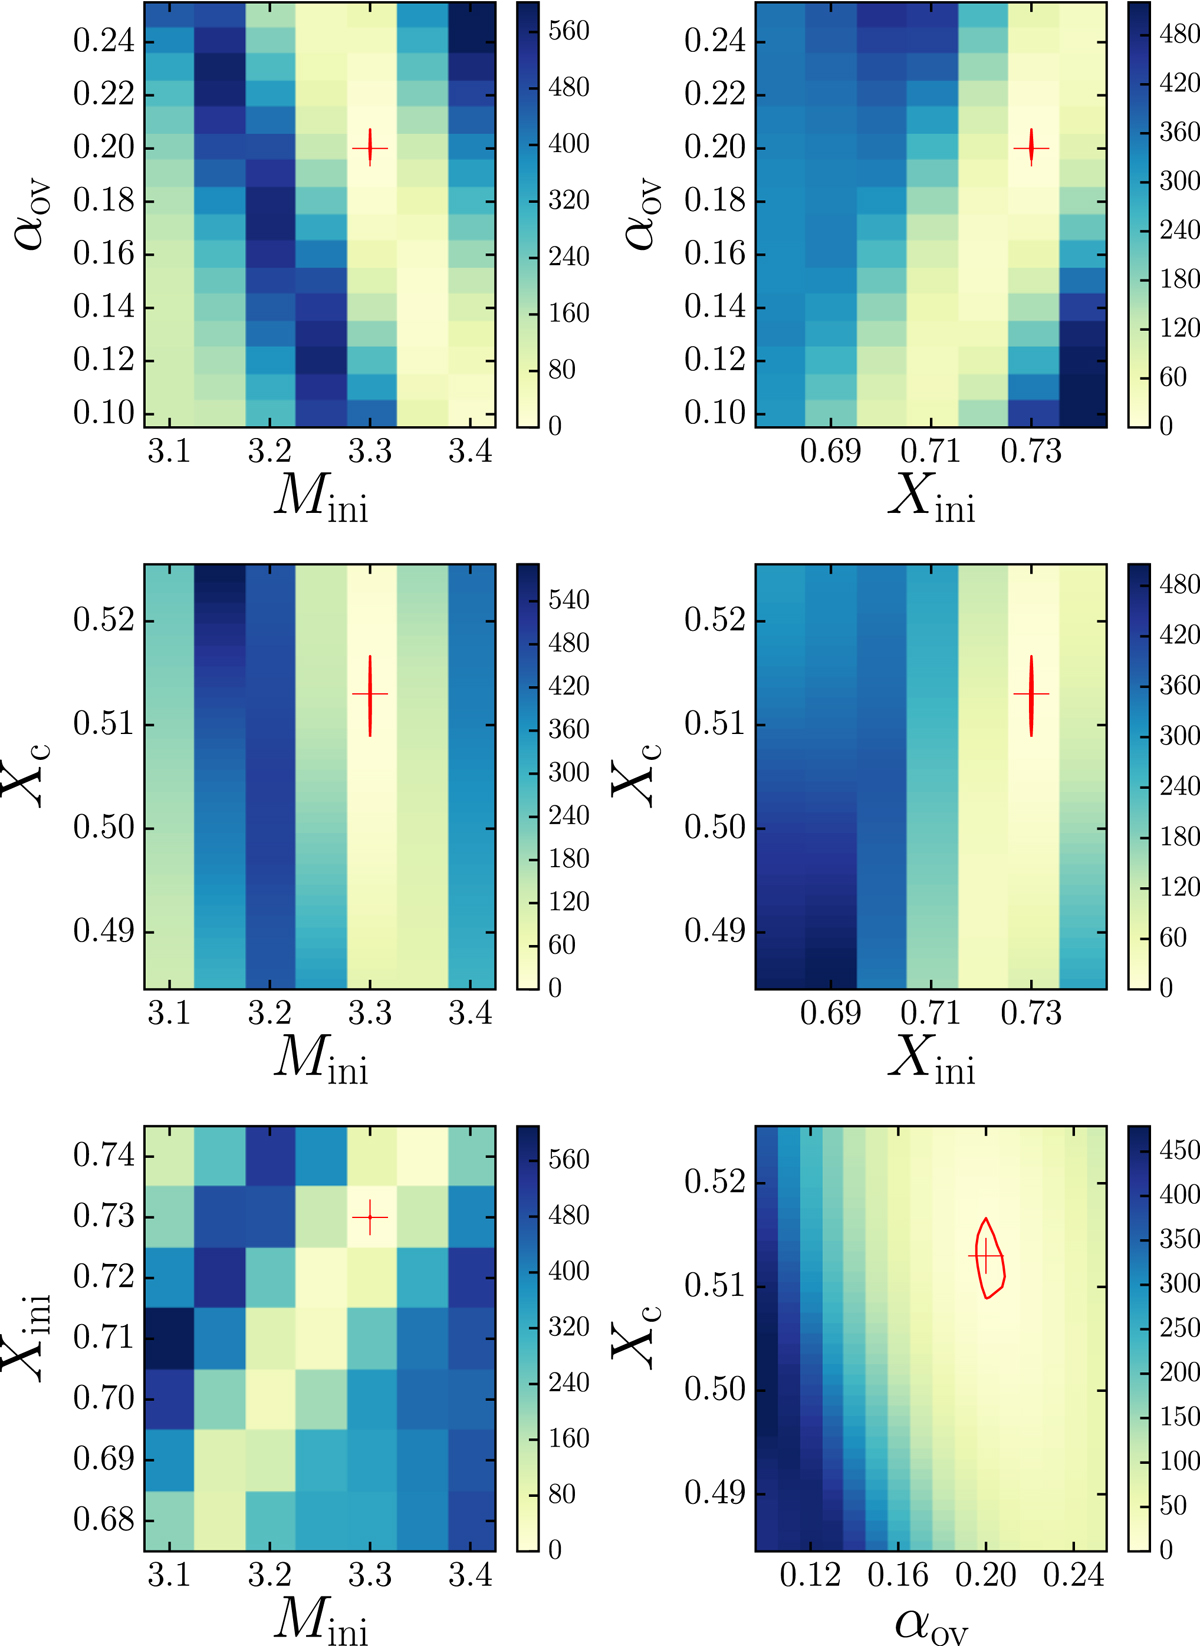
Two-dimensional plots for benchmark model A compared to the step overshooting grid showing the change in merit function as two parameters are varied and all others are kept fixed to those of the best matching step overshooting model at X c ~ 0.5. The red cross shows the position of the best fitting model in each of the plots and the red curves the 5.15 merit function cut-off contour lines for the best matching step overshooting model.
Current usage metrics show cumulative count of Article Views (full-text article views including HTML views, PDF and ePub downloads, according to the available data) and Abstracts Views on Vision4Press platform.
Data correspond to usage on the plateform after 2015. The current usage metrics is available 48-96 hours after online publication and is updated daily on week days.
Initial download of the metrics may take a while.