Fig. 3.
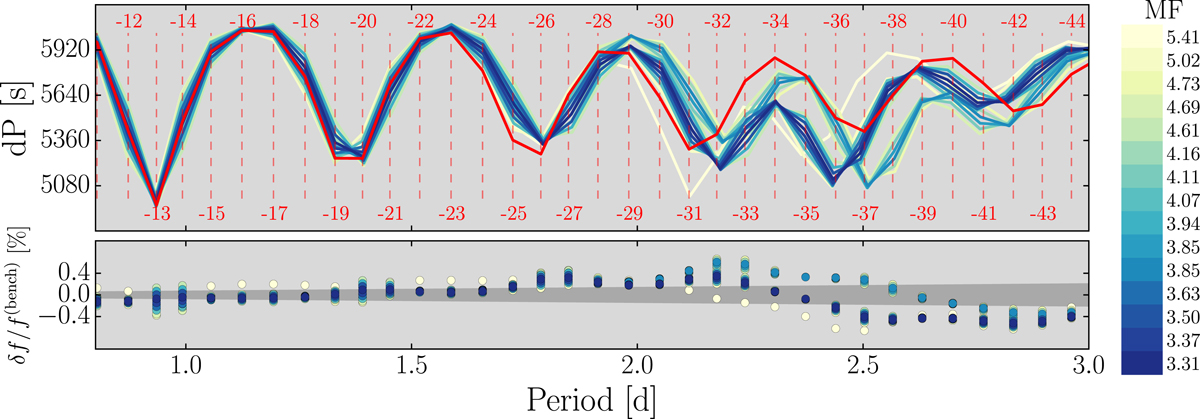
Period spacing series (upper panel) of the 15 best matching models resulting from comparing the exponential diffusive overshoot benchmark model A (red curve) to the step overshooting grid. The colours indicate the different values of the merit function, and the vertical dashed lines give the positions and values of the radial orders n of the benchmark model. The lower panel shows the frequency deviations in percentage between the benchmark model and the nearest frequencies of the exponential overshooting models. The position of the deviations in period space has been fixed to those of the benchmark model. The dark grey shaded region shows the Rayleigh limit for the Kepler mission.
Current usage metrics show cumulative count of Article Views (full-text article views including HTML views, PDF and ePub downloads, according to the available data) and Abstracts Views on Vision4Press platform.
Data correspond to usage on the plateform after 2015. The current usage metrics is available 48-96 hours after online publication and is updated daily on week days.
Initial download of the metrics may take a while.