Fig. 2.
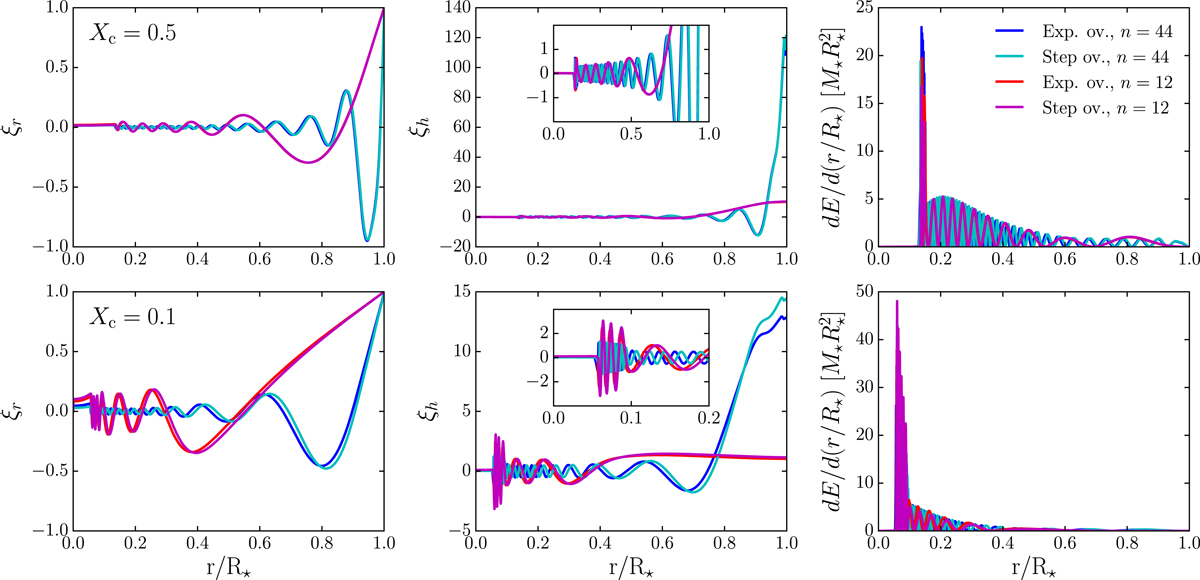
Radial (left) and horizontal (centre) components of the displacement vector for the n = 12 (in red) and n = 44 (in blue) dipole prograde g-modes of the benchmark models in Table 1, along with their differential mode inertia (right). The upper and lower panels are for benchmark model A/C (Xc = 0.5) and B/D (Xc = 0.1), respectively. The dark blue and red curves are for the exponential overshoot benchmark models (A/B), whereas the cyan and magenta curves are for the step overshoot benchmark models (C/D). The components of the displacement vectors have been normalised such that the radial components are one at the surface. The inserted second plots in the centre panels show a zoomed in version of the horizontal displacements.
Current usage metrics show cumulative count of Article Views (full-text article views including HTML views, PDF and ePub downloads, according to the available data) and Abstracts Views on Vision4Press platform.
Data correspond to usage on the plateform after 2015. The current usage metrics is available 48-96 hours after online publication and is updated daily on week days.
Initial download of the metrics may take a while.