Fig. 12.
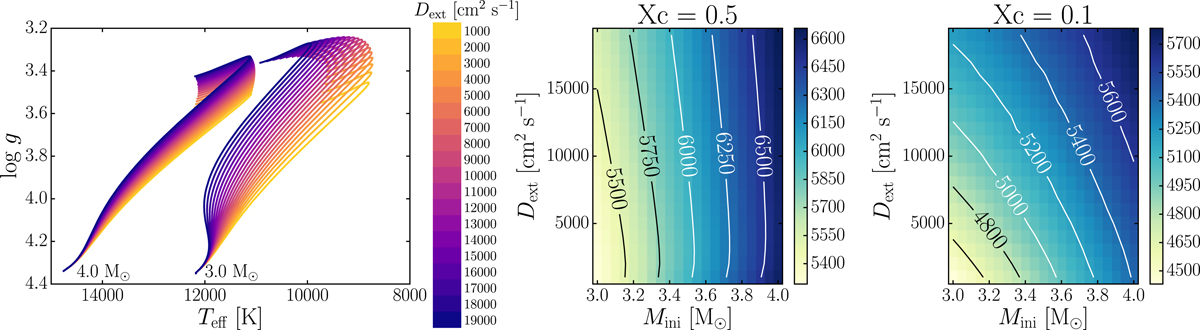
Left panel: effect of increasing D ext on the evolutionary tracks at two different initial stellar masses, using a D mix profile as in Fig. 1b. The darker the colour of the track, the higher the radiative envelope mixing. Centre and right panels: two-dimensional surface plots illustrating the correlations between M ini , D ext, and dP (given in seconds) at two different X c. The darker the colour, the higher the average period spacing value of the dipole prograde modes. The contour lines show positions of constant dP.
Current usage metrics show cumulative count of Article Views (full-text article views including HTML views, PDF and ePub downloads, according to the available data) and Abstracts Views on Vision4Press platform.
Data correspond to usage on the plateform after 2015. The current usage metrics is available 48-96 hours after online publication and is updated daily on week days.
Initial download of the metrics may take a while.