Fig. 11.
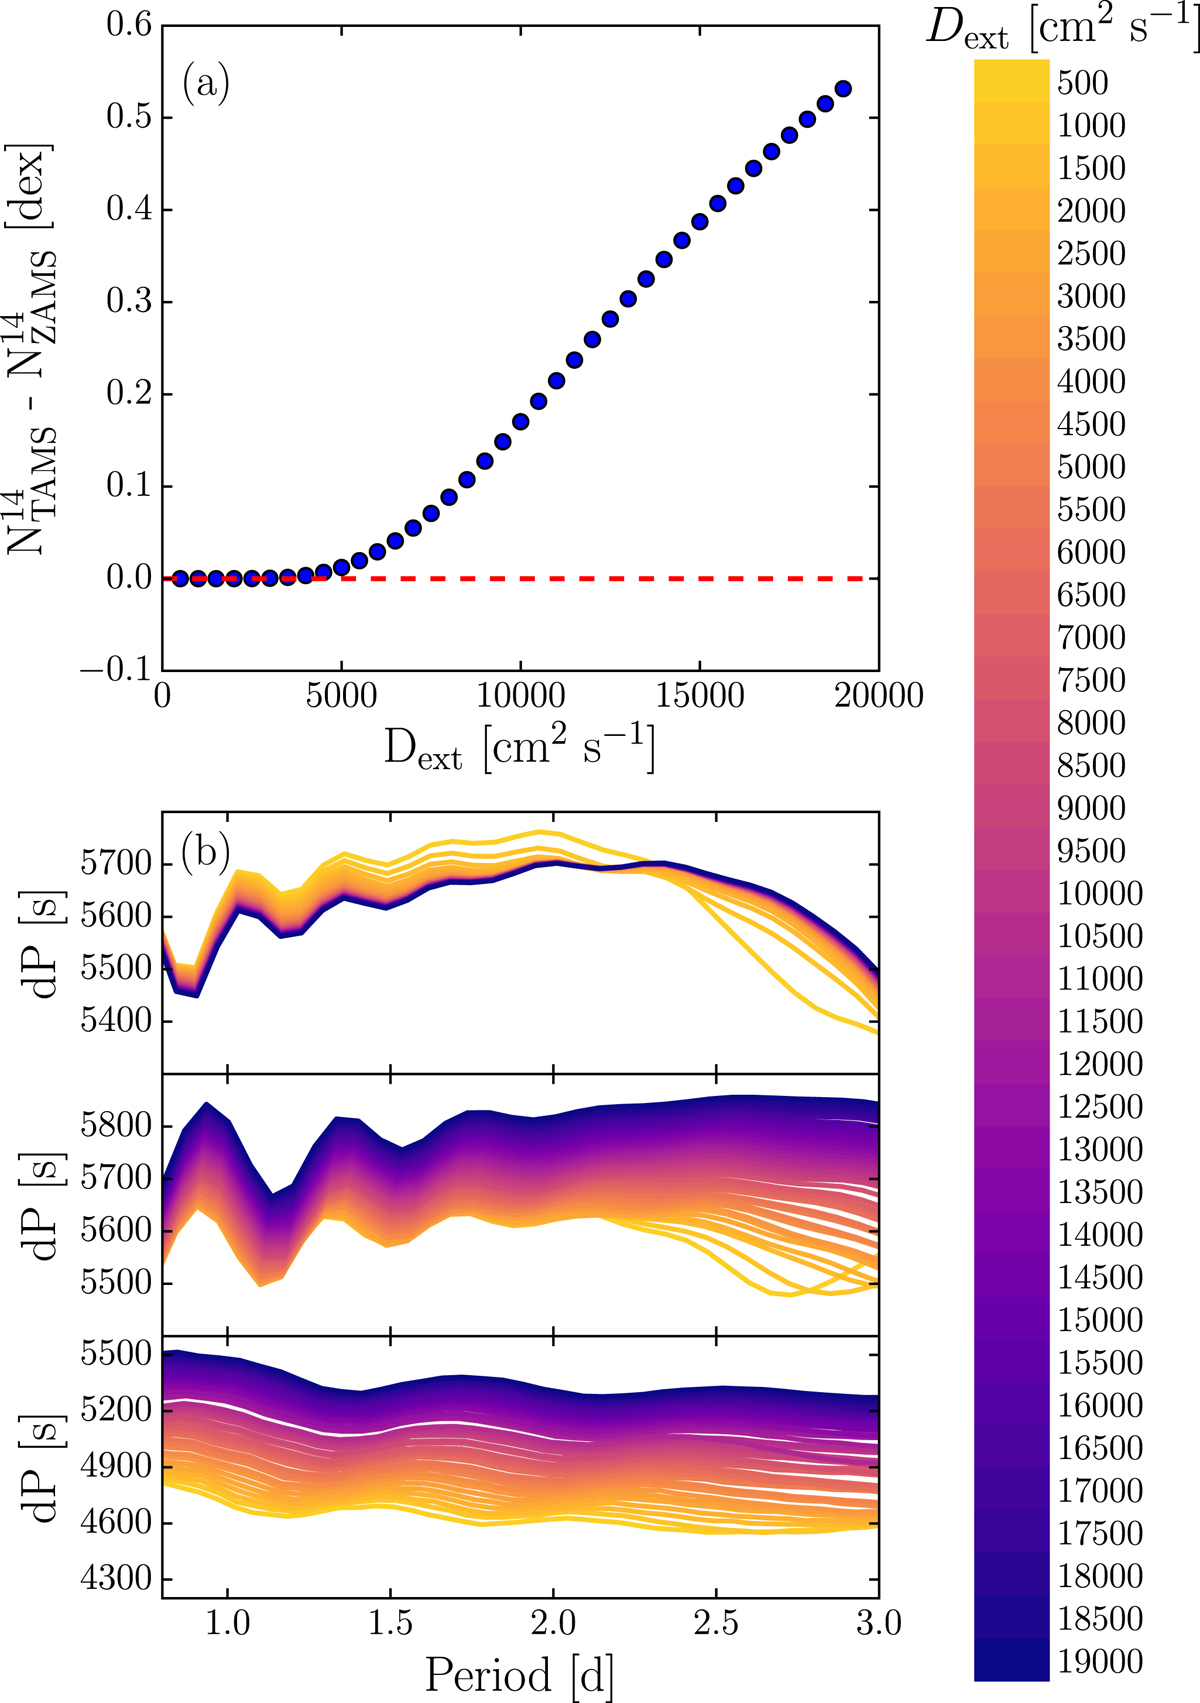
Surface nitrogen abundance enhancement during MS evolution as a function of D ext. Panel a: for an increasing radiative envelope mixing towards the surface of the stellar model based on the D mix profile in Fig. 1d. The red dashed line shows the change in N14 for a constant envelope mixing (Fig. 1b). Panel b: corresponding effects of varying D ext on the (l, m) = (1,1) period spacing series at X c = 0.7, 0.5, and 0.1 (from top to bottom). See text for further explanation.
Current usage metrics show cumulative count of Article Views (full-text article views including HTML views, PDF and ePub downloads, according to the available data) and Abstracts Views on Vision4Press platform.
Data correspond to usage on the plateform after 2015. The current usage metrics is available 48-96 hours after online publication and is updated daily on week days.
Initial download of the metrics may take a while.