Fig. 6
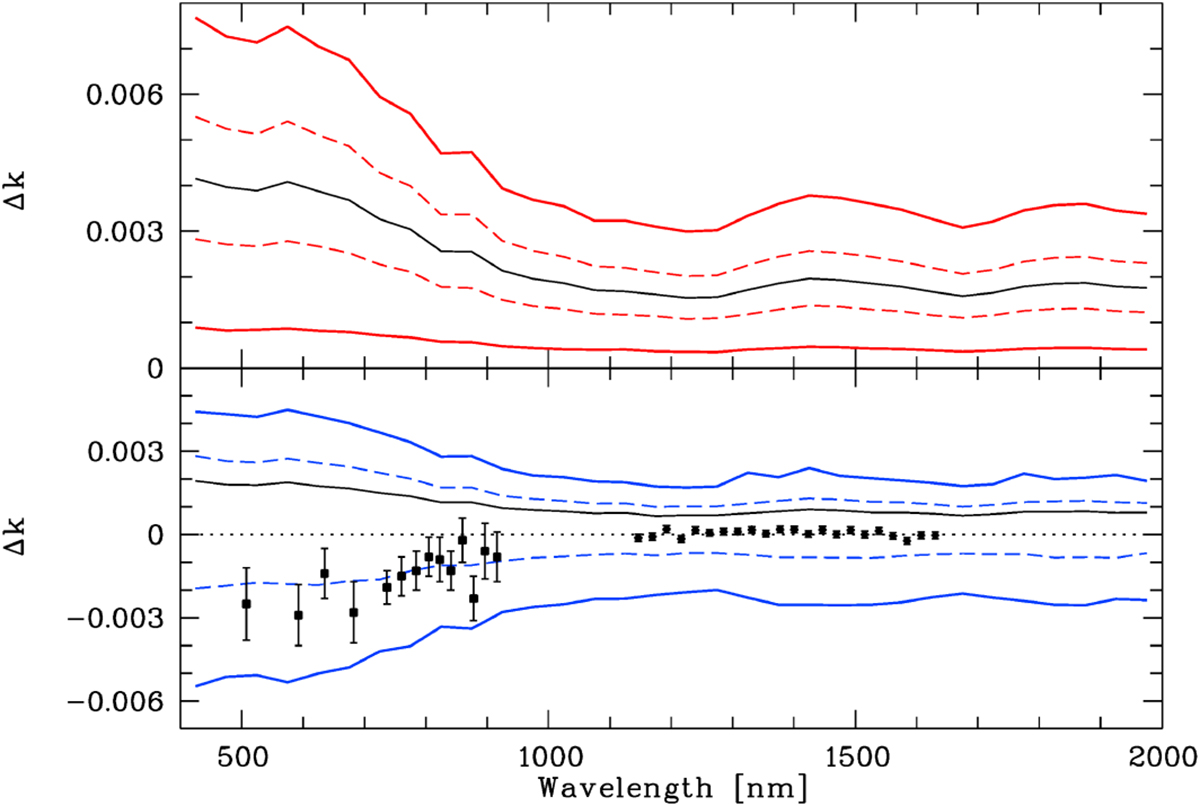
Modifications of the planet to star radius ratio by spots. The upper plot shows the variations (Δ k = k − kunspotted) with wavelength, which we derived from analyzing the 635 simulated transits in 32 wavelength bins. The black line indicates themean values of Δk for each wavelength bin with the dashed red line indicating the 68 % confidence interval. The solid red lines indicate the region between the minimum and maximum Δ k. In the bottom plot, we show the same for the 278 transits occurring during seasons 2013 and 2014, without removing spot crossing features. The blue lines indicate the region between the minimum and maximum Δ k. The overplotted optical measurements are from Rackham et al. (2017), the NIR data are from Kreidberg et al. (2014).
Current usage metrics show cumulative count of Article Views (full-text article views including HTML views, PDF and ePub downloads, according to the available data) and Abstracts Views on Vision4Press platform.
Data correspond to usage on the plateform after 2015. The current usage metrics is available 48-96 hours after online publication and is updated daily on week days.
Initial download of the metrics may take a while.