Fig. 4
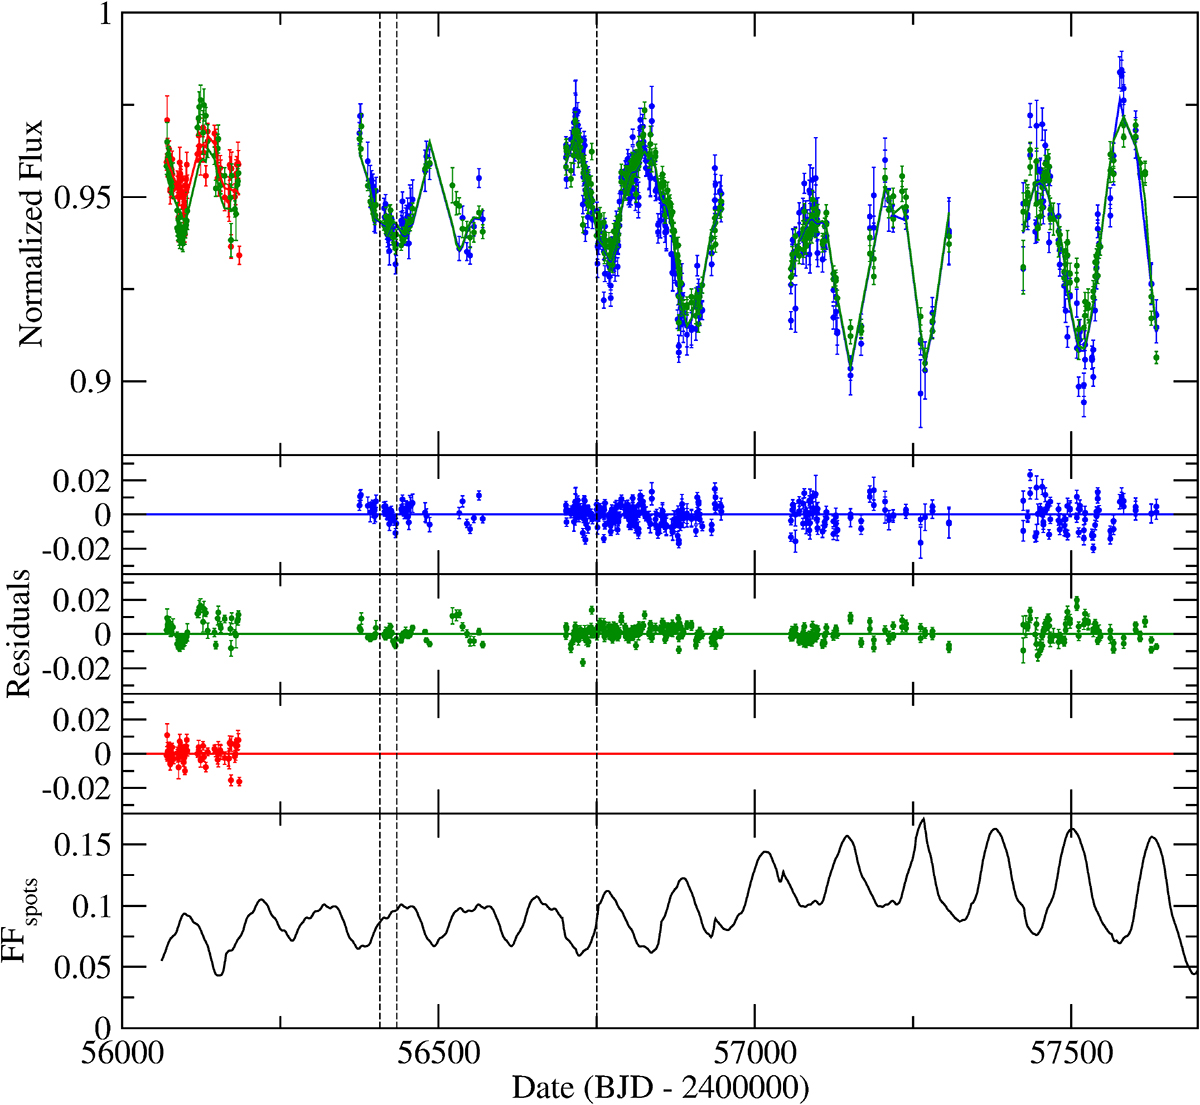
Top panel: light curves of GJ 1214 from 2012 to 2016. Blue data points denote measurements in the Johnson B filter, whereas green and red points indicate observations in the Johnson V and Cousin I filter, respectively. The photometric zero points are set according to the results presented in Table 2. The light curve models obtained with StarSim for the three bands are plotted with solid lines. Middle panels: residuals between the data and the model for the B, V, and I filter (from top to bottom). Bottom panel: Evolution of the projected filling factor of spots for the best fitting model obtained with StarSim. The three vertical dashed lines in all panels indicate the mid times of the transits analyzed by Rackham et al. (2017).
Current usage metrics show cumulative count of Article Views (full-text article views including HTML views, PDF and ePub downloads, according to the available data) and Abstracts Views on Vision4Press platform.
Data correspond to usage on the plateform after 2015. The current usage metrics is available 48-96 hours after online publication and is updated daily on week days.
Initial download of the metrics may take a while.