Free Access
Fig. 2
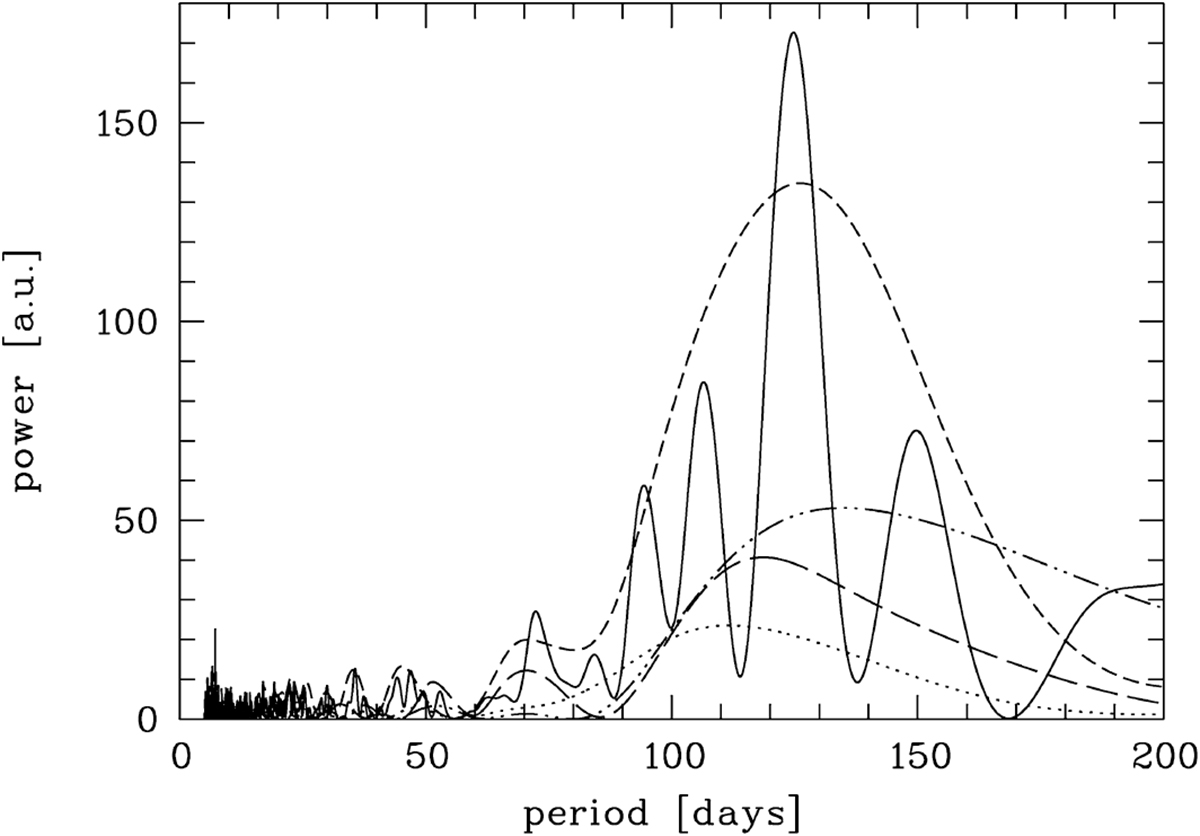
Lomb-Scargle periodogram of the differential light curve of GJ 1214. The black line gives the combined data set B+V from 2014 to 2016, the dotted, short dashed, long dashed, and dashed-dotted lines shows the result for the B+V data of individual years 2013, 2014, 2015, and 2016, respectively.
Current usage metrics show cumulative count of Article Views (full-text article views including HTML views, PDF and ePub downloads, according to the available data) and Abstracts Views on Vision4Press platform.
Data correspond to usage on the plateform after 2015. The current usage metrics is available 48-96 hours after online publication and is updated daily on week days.
Initial download of the metrics may take a while.