Free Access
Fig. 5
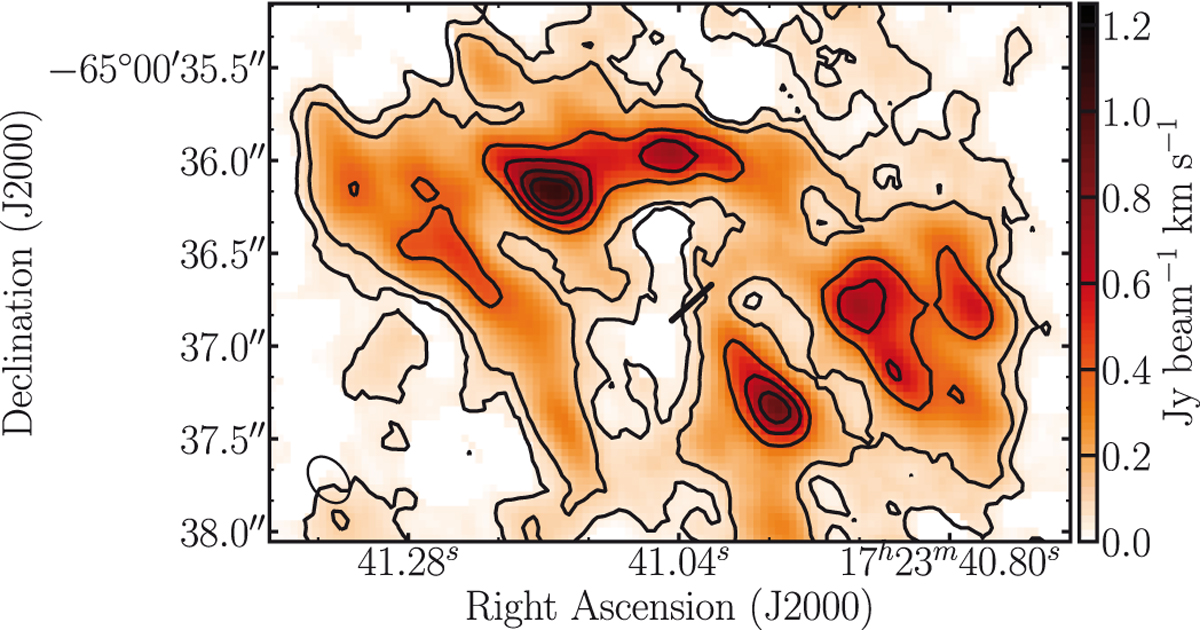
Total intensity map of the 12CO (2–1) line detected in the innermost 1.5 kpc of PKS B1718–649. Contour levels are 3, 5, 8, 12, 15 and 18σ (1σ = 0.14 Jy beam−1 km s−1). The black line shows the position angle of the radio AGN. The beam (0.2′′) is shown in black in the bottom left corner.
Current usage metrics show cumulative count of Article Views (full-text article views including HTML views, PDF and ePub downloads, according to the available data) and Abstracts Views on Vision4Press platform.
Data correspond to usage on the plateform after 2015. The current usage metrics is available 48-96 hours after online publication and is updated daily on week days.
Initial download of the metrics may take a while.