Fig. 2
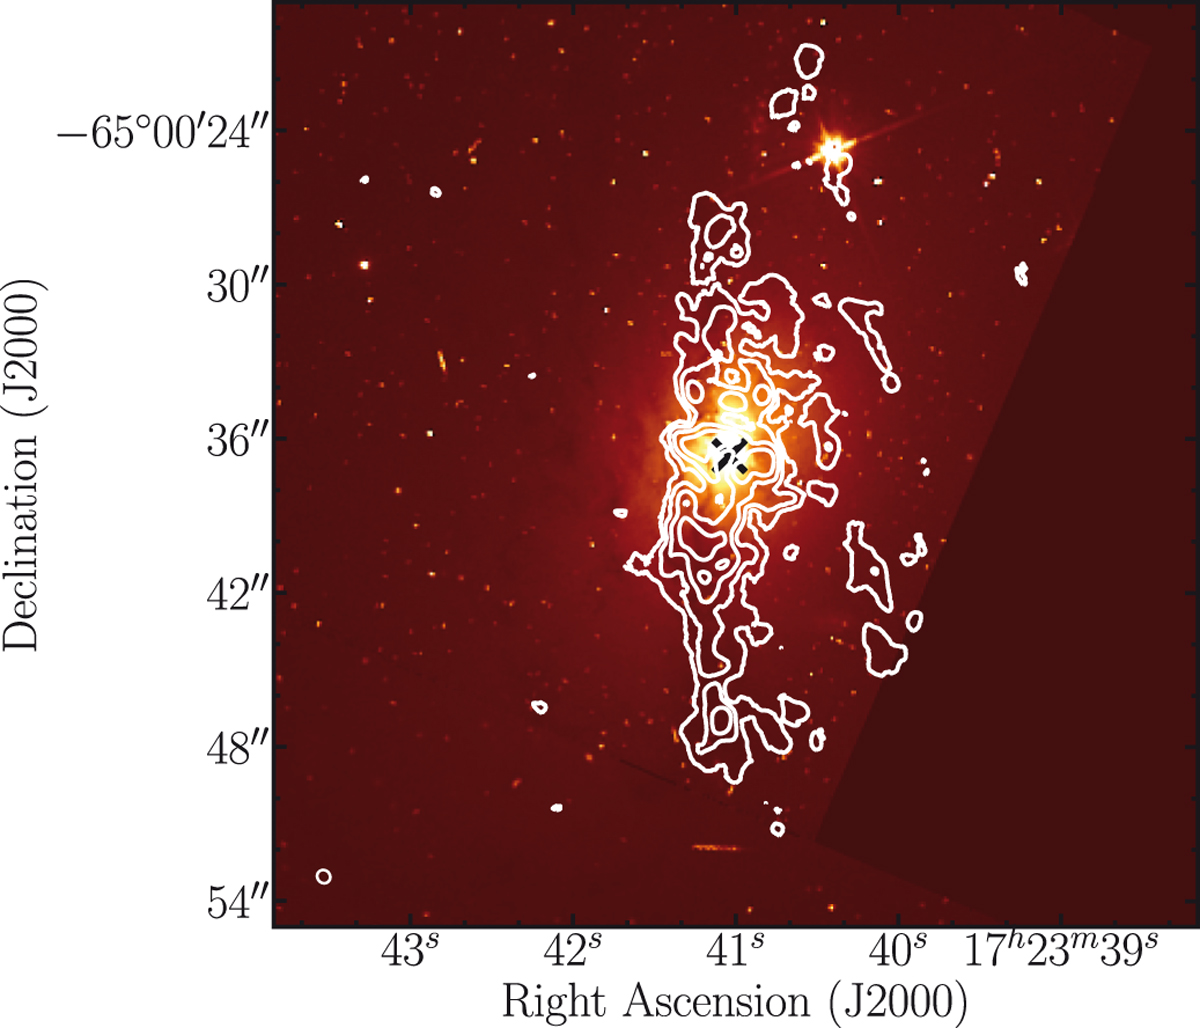
Hubble Space Telescope WFPC2 image of PKS B1718–649 with the contours of the total intensity map of the 12CO (2–1) line detected in the innermost 15 kpc overlaid. Contour levels are 3, 6, 12 and 18σ. This and all intensity maps shown in this paper are not corrected for the primary beam of ALMA. The 230 GHz continuum emission of the radio AGN is indicated with a black cross. The resolution of the total intensity map is 0.5′′. The beam isshown in white in the bottom left corner.
Current usage metrics show cumulative count of Article Views (full-text article views including HTML views, PDF and ePub downloads, according to the available data) and Abstracts Views on Vision4Press platform.
Data correspond to usage on the plateform after 2015. The current usage metrics is available 48-96 hours after online publication and is updated daily on week days.
Initial download of the metrics may take a while.