Fig. 11
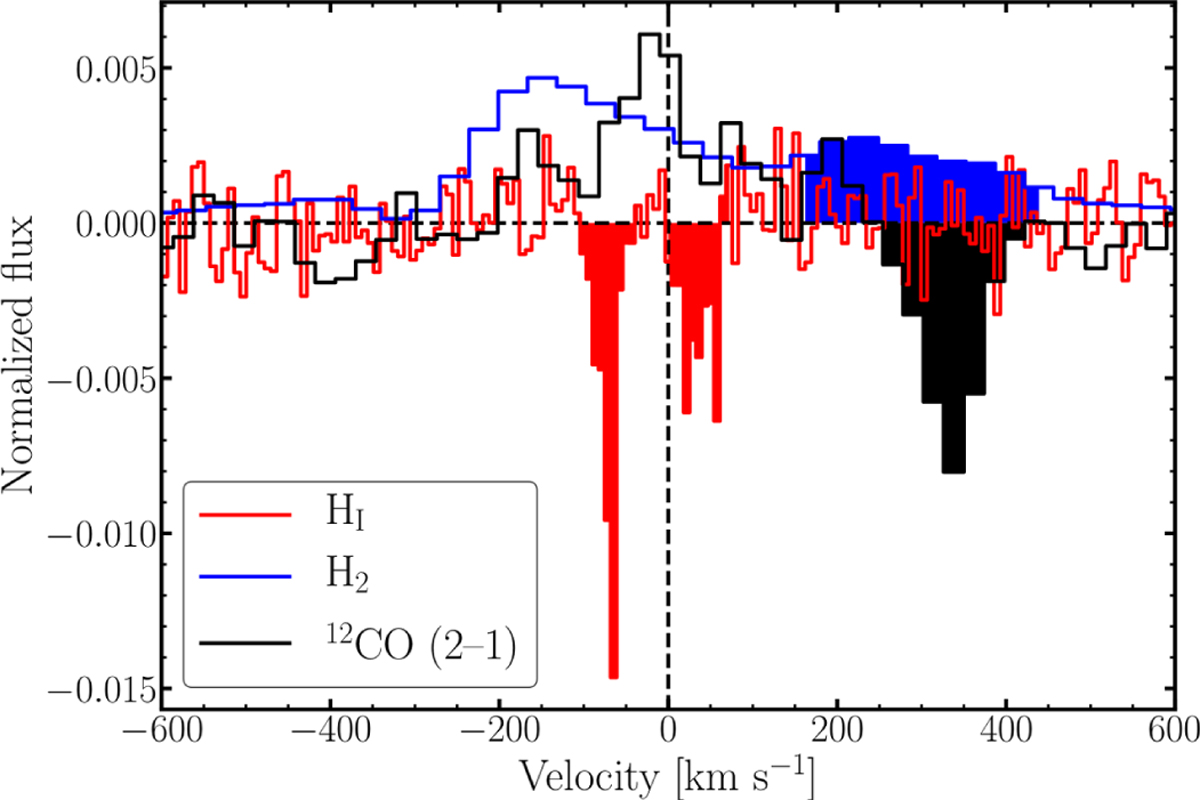
Spectra of the H I (red), H2 (blue) and 12CO (2–1) (black) gas extracted against the compact radio continuum emission of PKS B1718–649. Two separate lines are detected in the H I gas with opposite velocities with respect to the systemic. The 12CO (2–1) detected in absorption peaks at red-shifted velocities (Δv ~ 343 km s−1) with respect to the systemic (black dashed line). The H2 gas is detected in emission at the systemic velocity and at the velocities of the red-shifted absorption line of 12CO (2–1) gas. The spectrum of the H2 gas has been normalized to the maximum of the spectrum of the 12CO (2–1) line (see Sect. 3.3 for further details). The shaded regions of the lines are tracing gas that is not regularly rotating.
Current usage metrics show cumulative count of Article Views (full-text article views including HTML views, PDF and ePub downloads, according to the available data) and Abstracts Views on Vision4Press platform.
Data correspond to usage on the plateform after 2015. The current usage metrics is available 48-96 hours after online publication and is updated daily on week days.
Initial download of the metrics may take a while.