Fig. 10
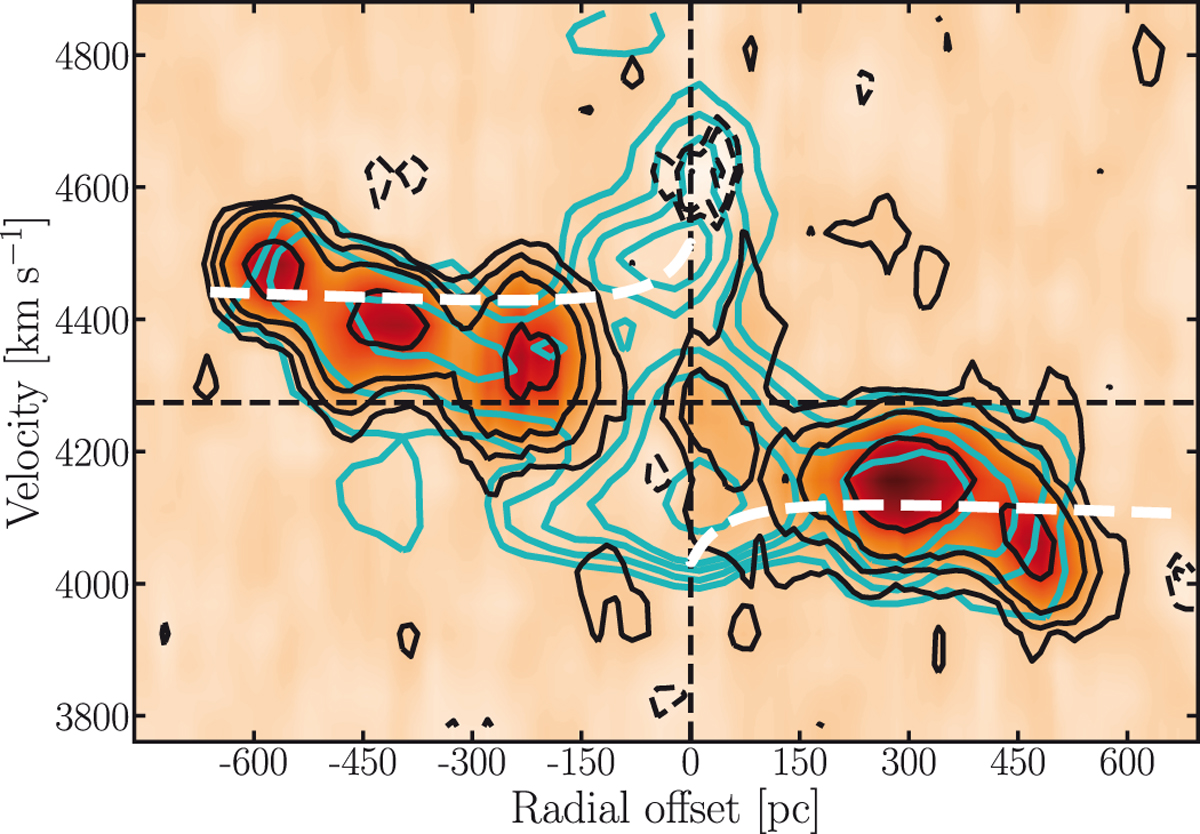
Position-velocity diagram taken along the major axis of the circumnuclear disk PKS B1718–649 (PA = 72°), integrated over 0.5″ in the direction perpendicular to the major axis. Black solid and dashed contours show the 12CO (2–1) emission and absorption, respectively. Cyan contours show the H2 emission. Contour levels are − 5, −3, − 2σ and 3, 6, 12, 18, 24σ, respectively.The white dashed line shows the rotation curve predicted from the stellar distribution and the contribution of the SMBH to the rotation (see the text for further details).
Current usage metrics show cumulative count of Article Views (full-text article views including HTML views, PDF and ePub downloads, according to the available data) and Abstracts Views on Vision4Press platform.
Data correspond to usage on the plateform after 2015. The current usage metrics is available 48-96 hours after online publication and is updated daily on week days.
Initial download of the metrics may take a while.