Fig. 5
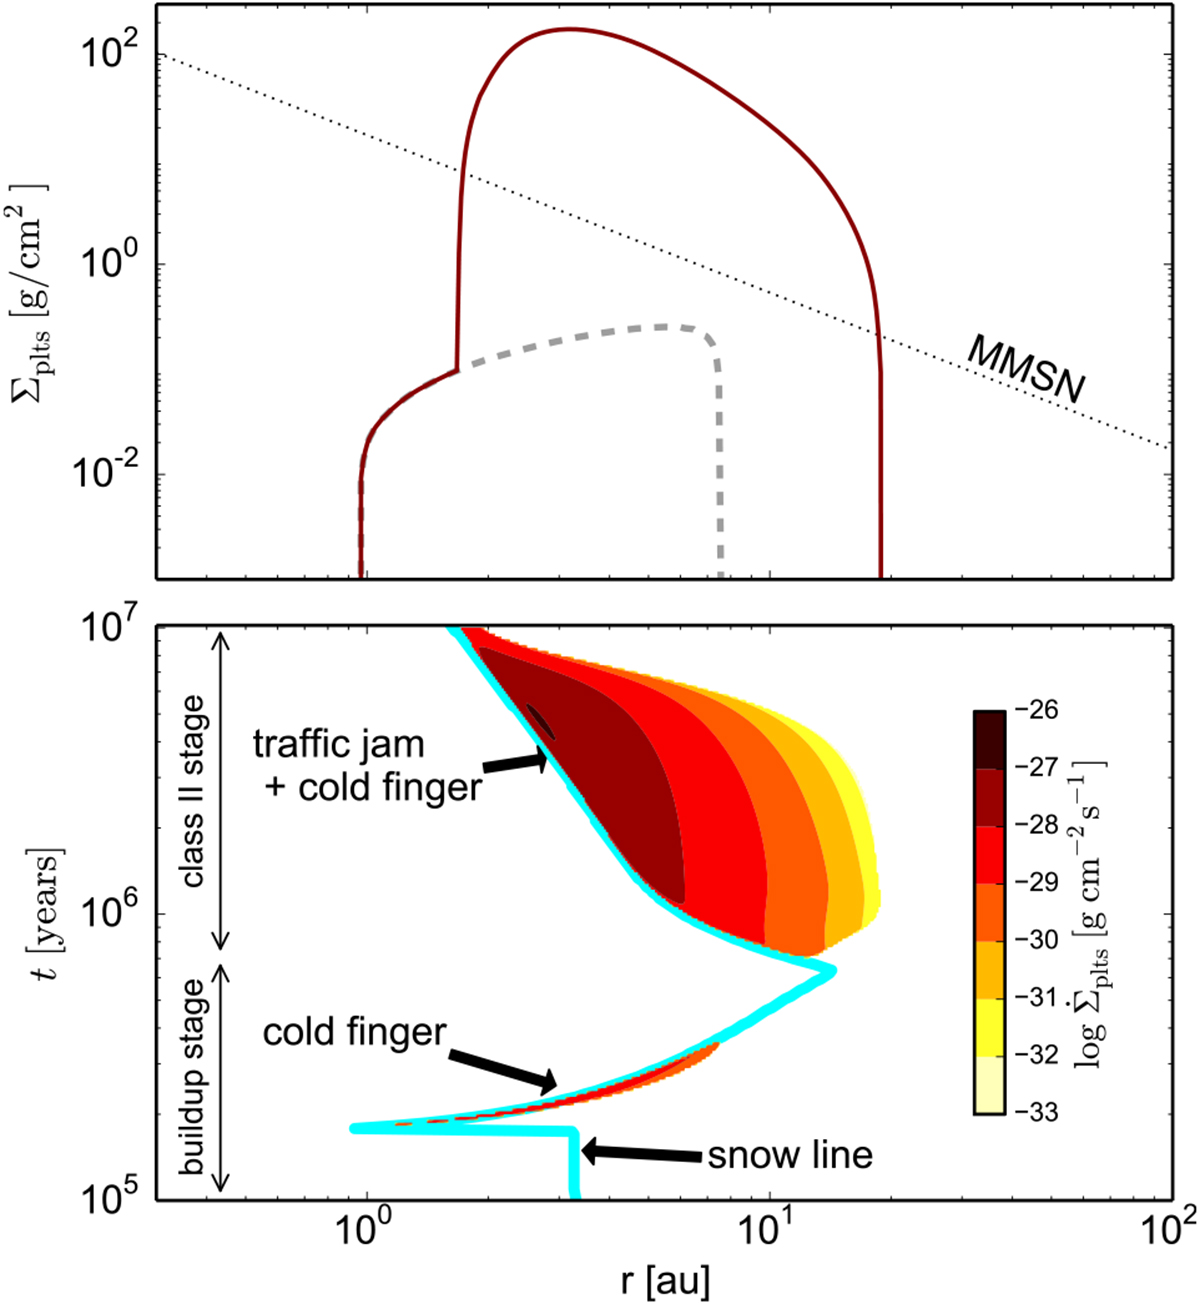
Upper panel: surface density of planetesimals at the end of the disk buildup stage (at 7 × 10⁵ yr, gray dashed line) and at the end of the disk lifetime (at 107 years, red solid line) obtained in the model with αv = 10−3 and αt = 10−5. The black dotted line corresponds to the minimum mass solar nebula. Lower panel: radial and time distribution of planetesimal formation in the same model. The light blue solid line shows the location of the snow line.
Current usage metrics show cumulative count of Article Views (full-text article views including HTML views, PDF and ePub downloads, according to the available data) and Abstracts Views on Vision4Press platform.
Data correspond to usage on the plateform after 2015. The current usage metrics is available 48-96 hours after online publication and is updated daily on week days.
Initial download of the metrics may take a while.