Free Access
Fig. 2
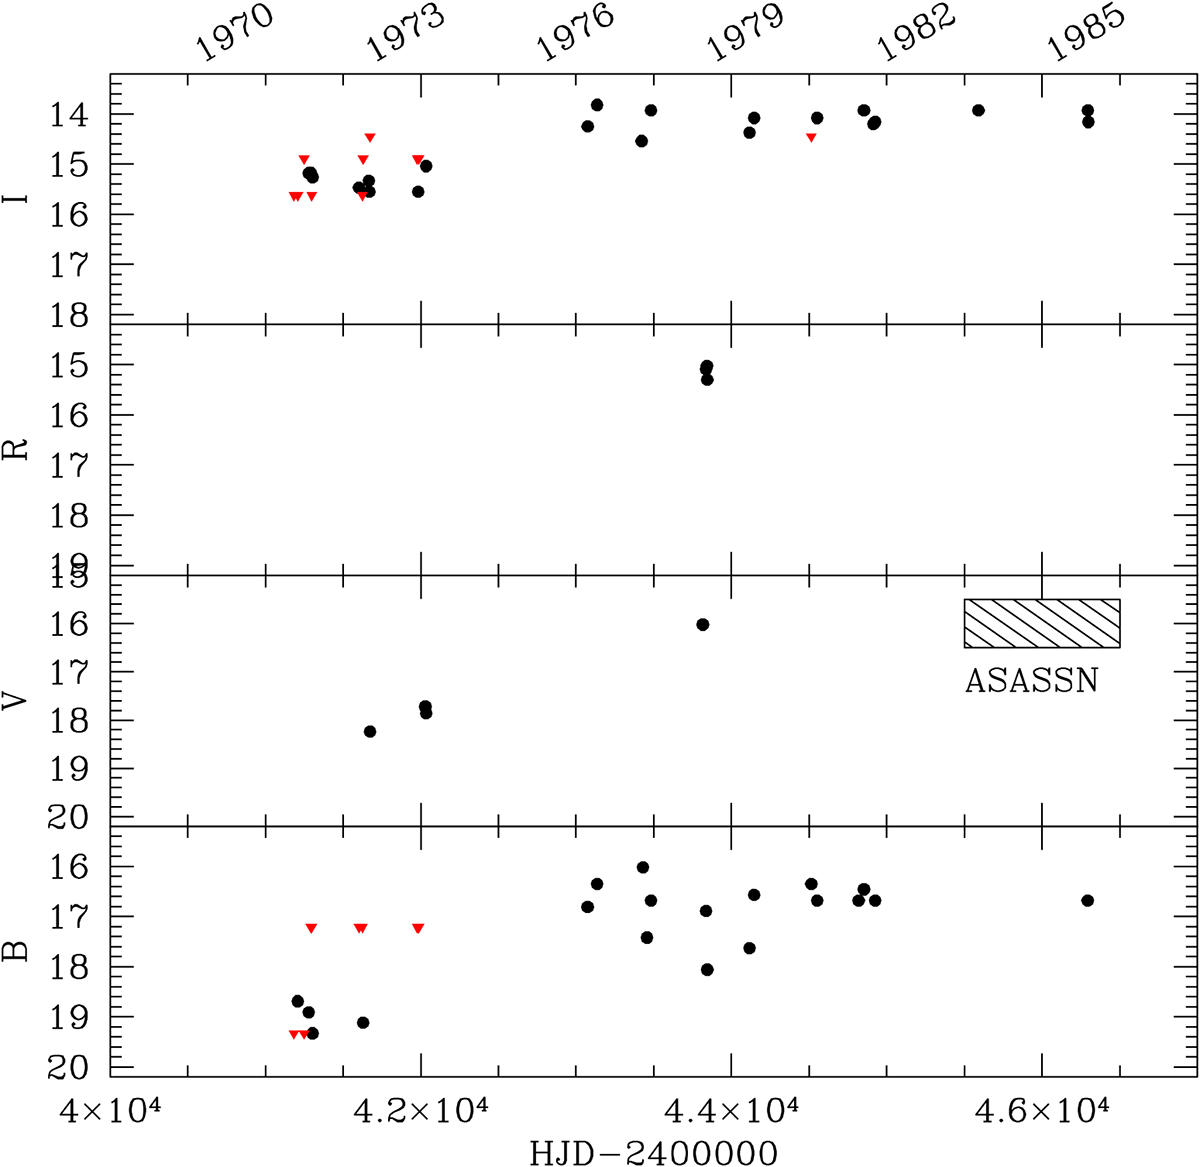
BV RI light curves of V350 Cep. Upper limits are given as solid red triangles. The hatched box on the right-hand side of the V -band panel indicates the spread of magnitudes obtained in the period 2014–2017 by the survey ASASSN (see text).
Current usage metrics show cumulative count of Article Views (full-text article views including HTML views, PDF and ePub downloads, according to the available data) and Abstracts Views on Vision4Press platform.
Data correspond to usage on the plateform after 2015. The current usage metrics is available 48-96 hours after online publication and is updated daily on week days.
Initial download of the metrics may take a while.