Fig. 7
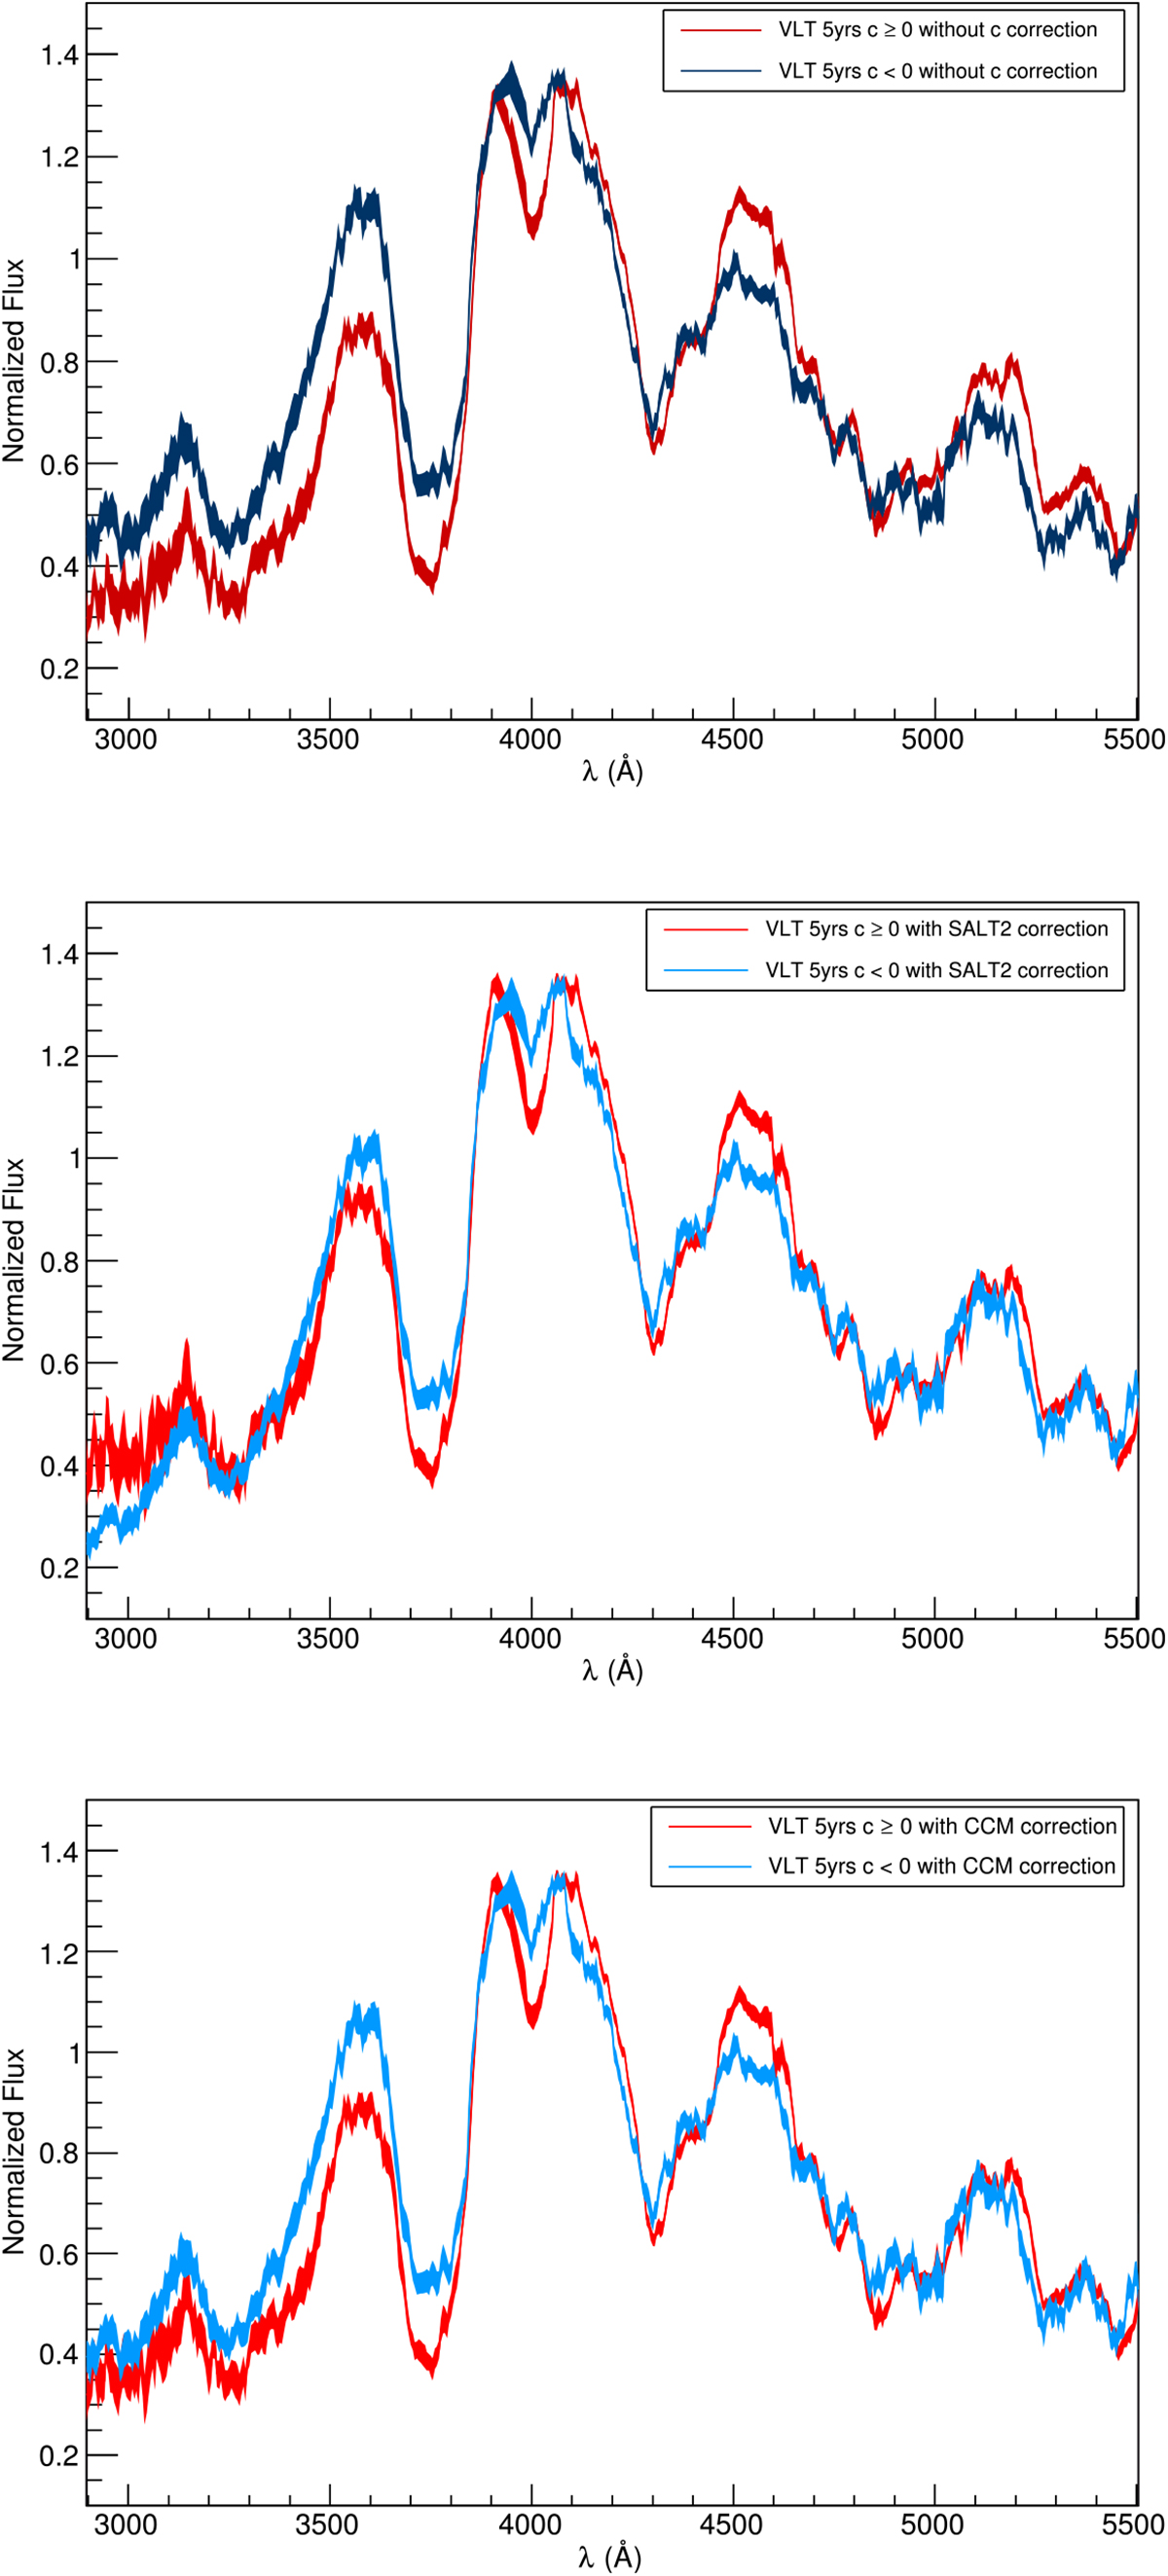
Comparison of composite spectra from the full VLT five year sample split in color, without color correction (top panel), with color correction using the SALT2 color law (middle panel) and with color correction using the CCM law (bottom panel). In each panel, the blue spectrum is built from c < 0 SNe Ia, the red spectrum from c ≥ 0 SNe Ia. No recalibration has been applied to individual spectra (see text for details). Residual host-galaxy lines have been removed. A ± 1σ range is plotted.
Current usage metrics show cumulative count of Article Views (full-text article views including HTML views, PDF and ePub downloads, according to the available data) and Abstracts Views on Vision4Press platform.
Data correspond to usage on the plateform after 2015. The current usage metrics is available 48-96 hours after online publication and is updated daily on week days.
Initial download of the metrics may take a while.