Free Access
Fig. 2
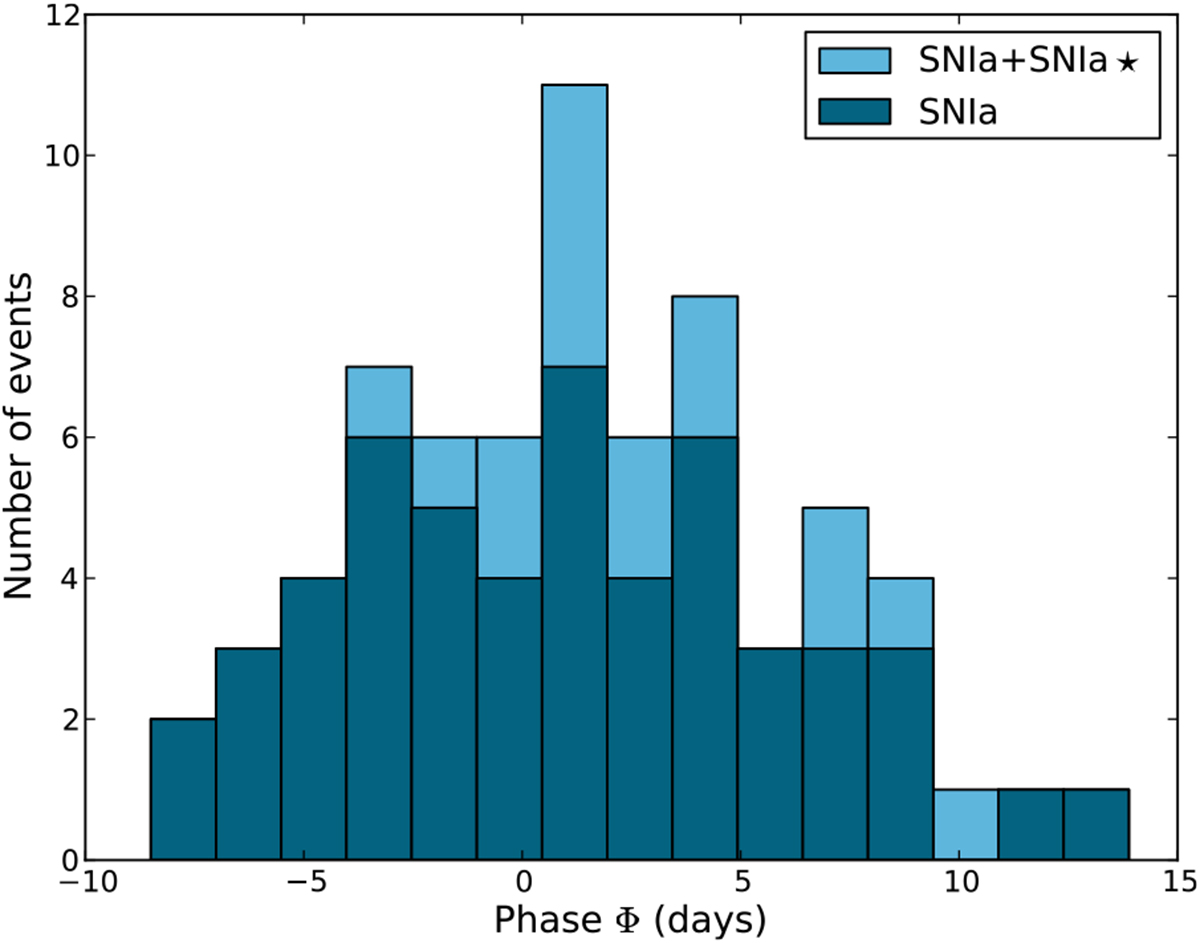
Phasedistribution of the VLT SNe Ia from the last two years of SNLS. SN Ia are shown in dark blue, SN Ia + SN Ia⋆ in light blue. The mean phase is ![]() days for the 51 SN Ia spectra and
days for the 51 SN Ia spectra and ![]() days for the 16 SN Ia⋆ spectra.
days for the 16 SN Ia⋆ spectra.
Current usage metrics show cumulative count of Article Views (full-text article views including HTML views, PDF and ePub downloads, according to the available data) and Abstracts Views on Vision4Press platform.
Data correspond to usage on the plateform after 2015. The current usage metrics is available 48-96 hours after online publication and is updated daily on week days.
Initial download of the metrics may take a while.