Fig. 9
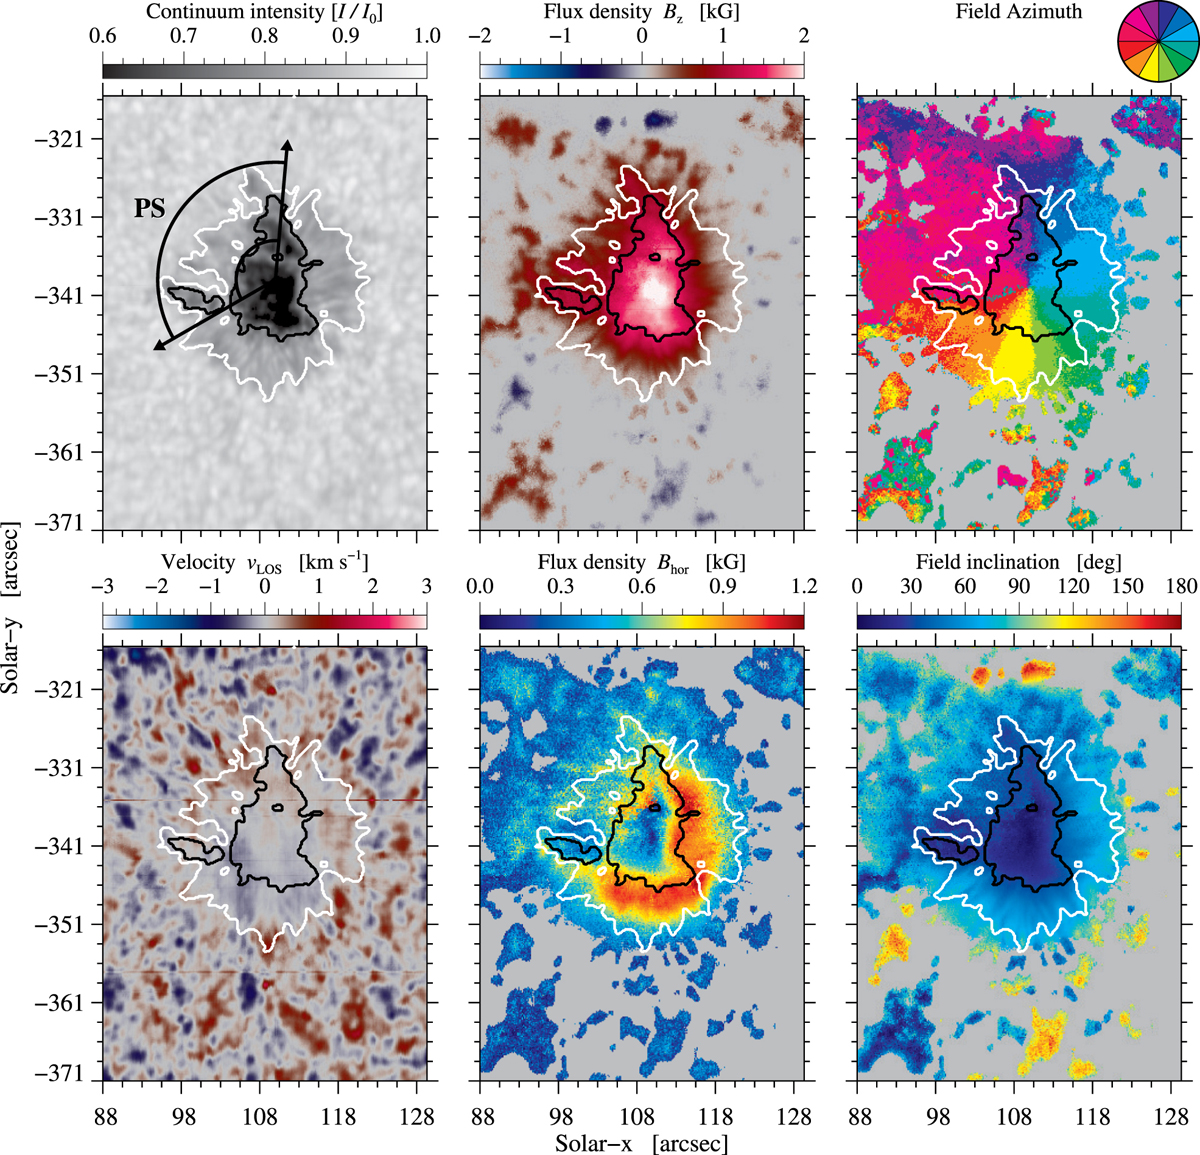
Maps of physical parameters derived for the Si i line using the SIR code for the GRIS scan starting at 09:02 UT on 2016 September 24: normalized intensity I∕I0, vertical component of magnetic flux density Bz, magnetic field azimuth ϕ, Doppler velocity vLOS, horizontal component of magnetic flux density Bhor, and magnetic field inclination γ (top-left to bottom-right). The polarization signal in the gray region is below the noise level. The two black arcs in the normalized intensity map mark the penumbral sector PS. We note that Bz, ϕ, and γ are in the local reference frame.
Current usage metrics show cumulative count of Article Views (full-text article views including HTML views, PDF and ePub downloads, according to the available data) and Abstracts Views on Vision4Press platform.
Data correspond to usage on the plateform after 2015. The current usage metrics is available 48-96 hours after online publication and is updated daily on week days.
Initial download of the metrics may take a while.