Fig. 8
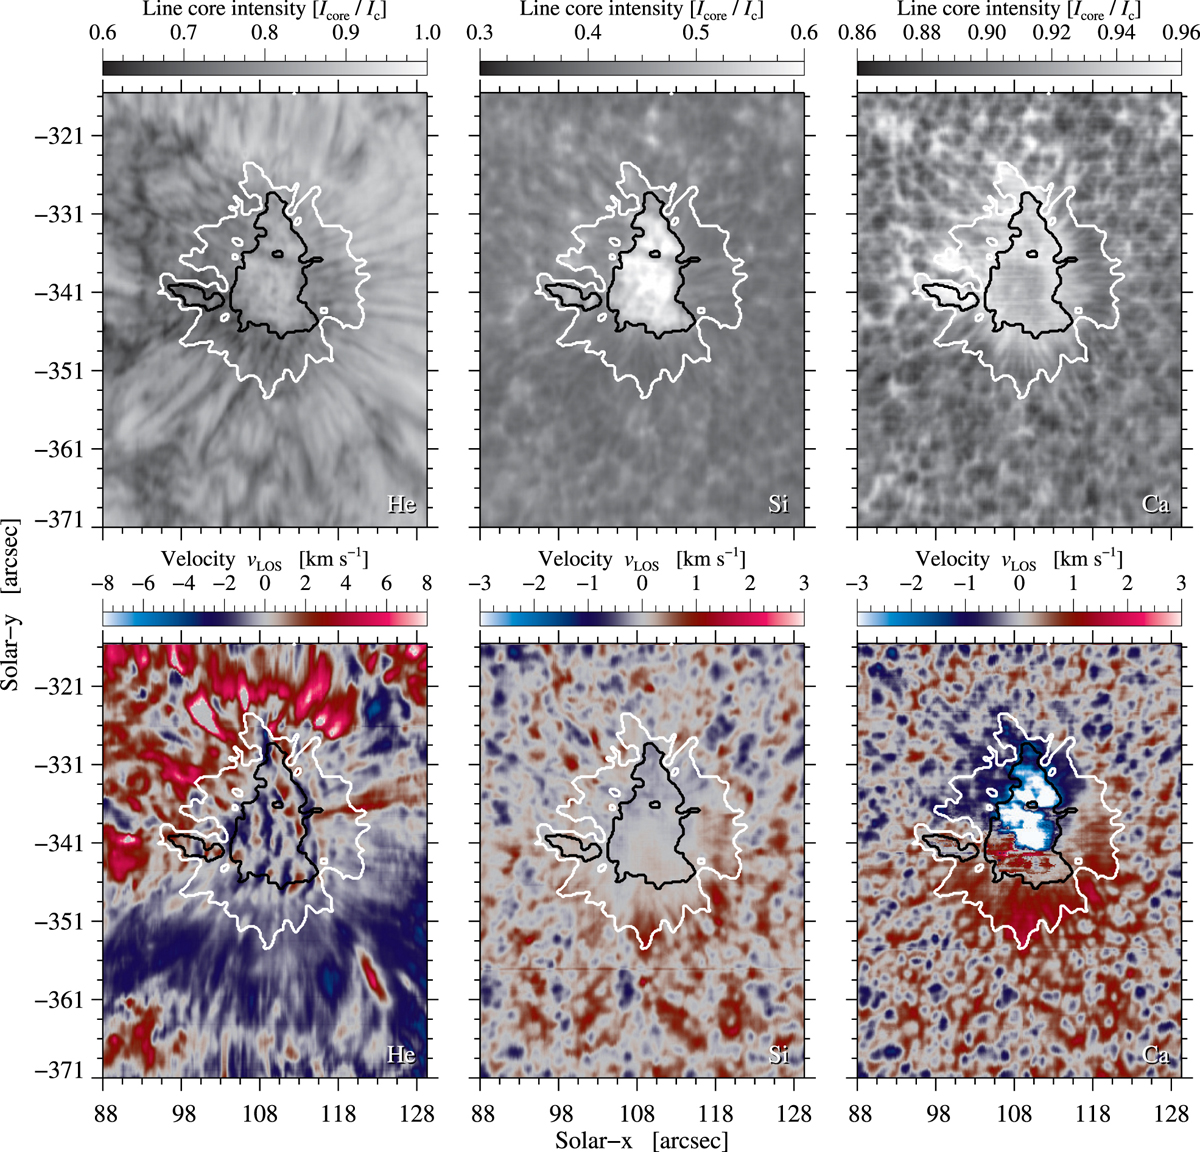
Slit-reconstructed maps of the line-core intensity (top) and the LOS velocity (bottom) for the spectral lines He I (left), Si I (middle), and Ca I (right) observed with GRIS at 09:02 UT on 2016 September 24. The contours are the same as shown in Fig. 7. Simple line-fitting did not deliver proper fits for the Ca I line profiles in the umbra, which appear as conspicuous white patches in the respective velocity map.
Current usage metrics show cumulative count of Article Views (full-text article views including HTML views, PDF and ePub downloads, according to the available data) and Abstracts Views on Vision4Press platform.
Data correspond to usage on the plateform after 2015. The current usage metrics is available 48-96 hours after online publication and is updated daily on week days.
Initial download of the metrics may take a while.