Fig. 7
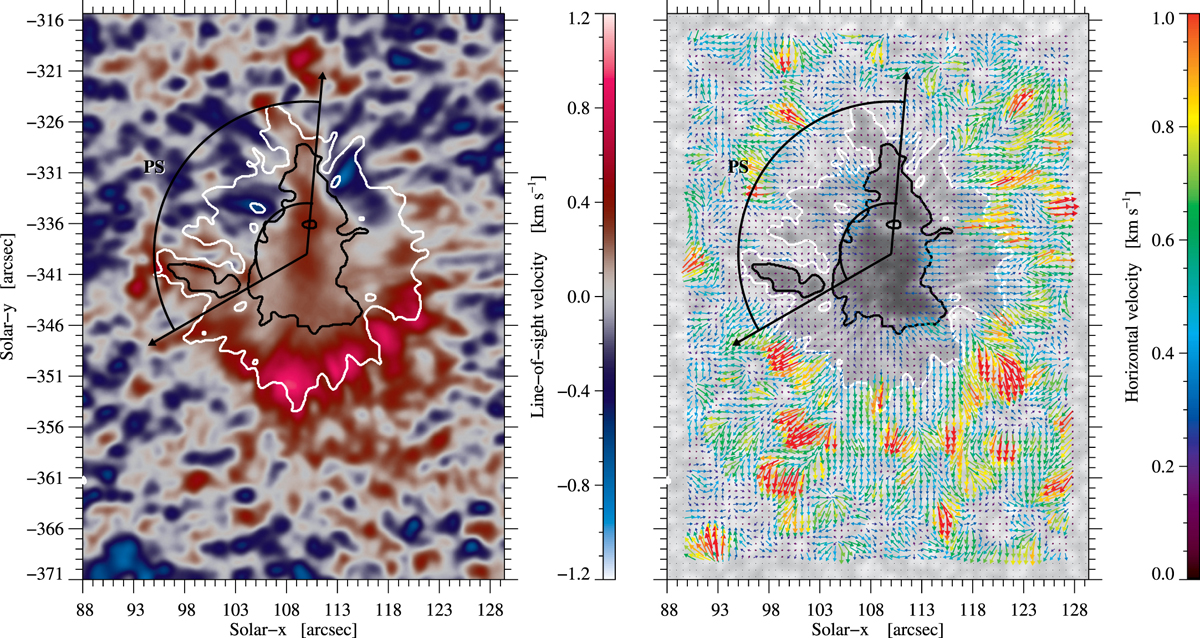
Mapsof GFPI averaged LOS velocity (left) and horizontal proper motions (right) around the leading spot P1, where color-coded vectors indicate magnitude and direction of the horizontal flows. The black contours mark the umbra-penumbra boundary, whereas the white contours denote the penumbra-granulation boundary. The contours shown here and in all subsequent figures are extracted from the GFPI broad-band image. The two black arcs mark the penumbral sector PS.
Current usage metrics show cumulative count of Article Views (full-text article views including HTML views, PDF and ePub downloads, according to the available data) and Abstracts Views on Vision4Press platform.
Data correspond to usage on the plateform after 2015. The current usage metrics is available 48-96 hours after online publication and is updated daily on week days.
Initial download of the metrics may take a while.