Fig. 5
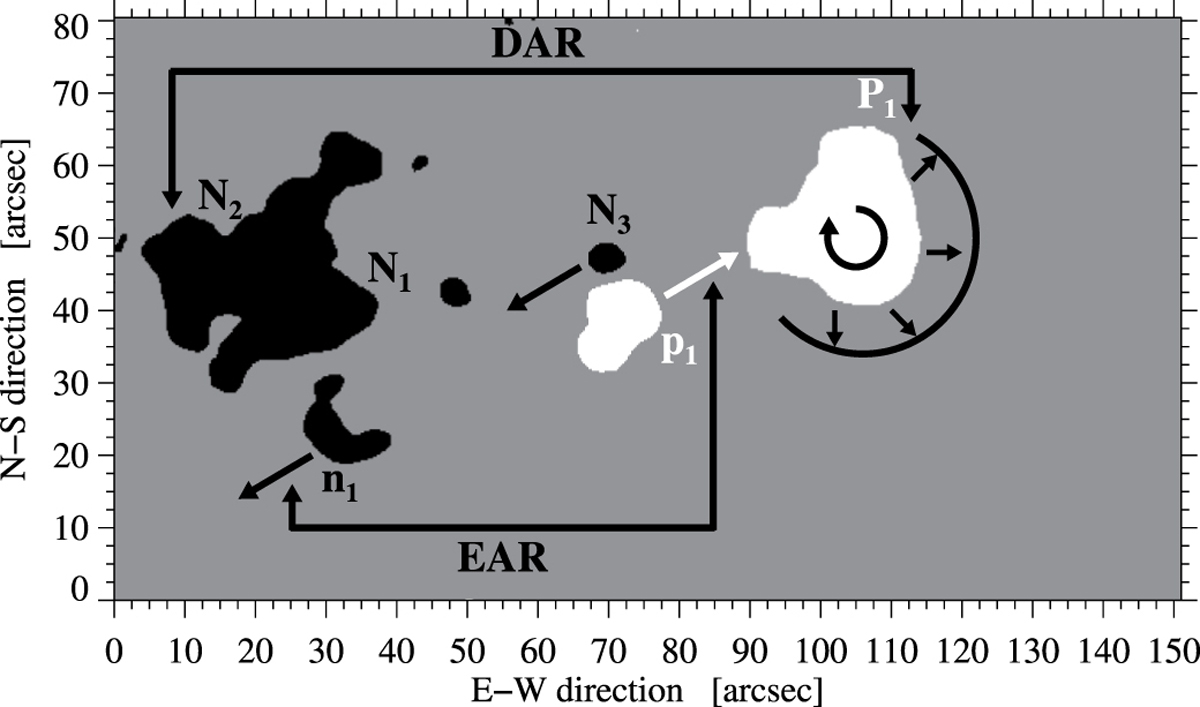
Sketch based on the HMI magnetogram observed at 09:00 UT on 2016 September 24. Black and white areas mark the negative and positive polarities, respectively. Arrows indicate the direction in which different features moved over the course of the day. The black semi-circle denotes the region around P1 with moat flow and MMFs. The black lines with vertical arrows mark the extent and features belonging to DAR and EAR, also labeled with upper- and lowercase letters.
Current usage metrics show cumulative count of Article Views (full-text article views including HTML views, PDF and ePub downloads, according to the available data) and Abstracts Views on Vision4Press platform.
Data correspond to usage on the plateform after 2015. The current usage metrics is available 48-96 hours after online publication and is updated daily on week days.
Initial download of the metrics may take a while.