Fig. 3
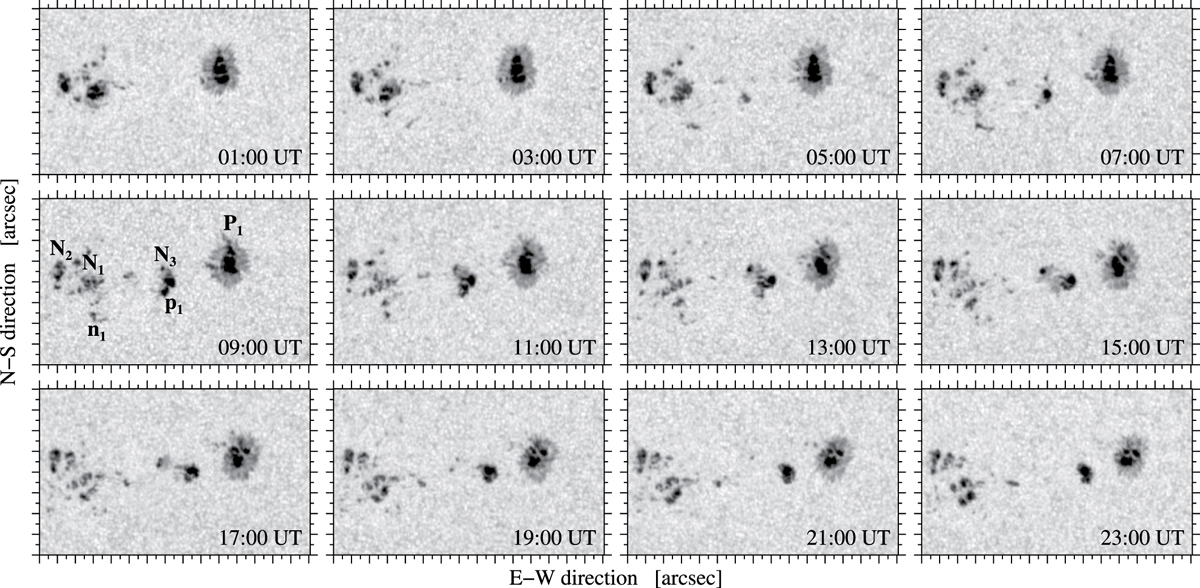
Evolution of active region NOAA 12597 on 2016 September 24 based on HMI continuum images with a FOV of 150′′ × 80′′. Major tick marks are placed at 10′′-intervals. The images were displayed at two-hour intervals starting at 01:00 UT. The abbreviations in the 09:00 UT panel indicate the leading spot P1, the trailing pores N1 and N2, the central negative pore N3, and the leading and trailing pores p1 and n1 of the emerging active region.
Current usage metrics show cumulative count of Article Views (full-text article views including HTML views, PDF and ePub downloads, according to the available data) and Abstracts Views on Vision4Press platform.
Data correspond to usage on the plateform after 2015. The current usage metrics is available 48-96 hours after online publication and is updated daily on week days.
Initial download of the metrics may take a while.