Fig. 3
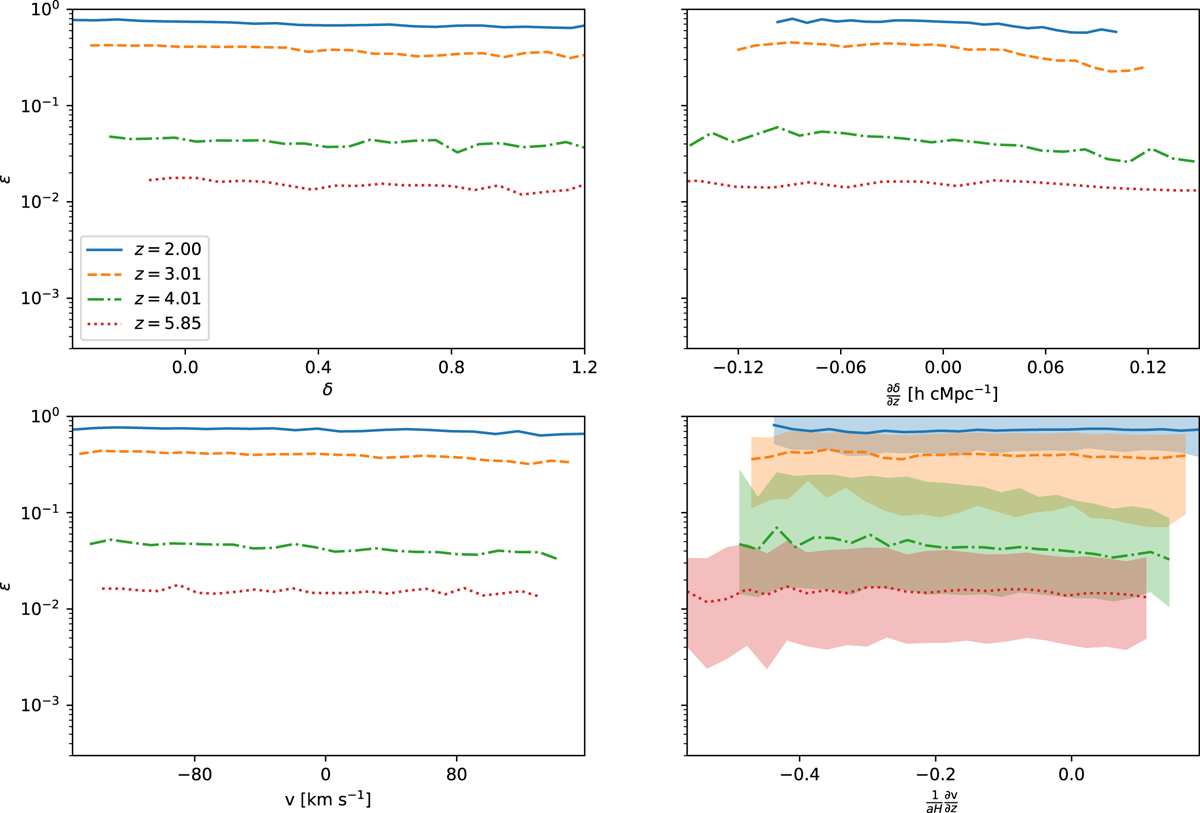
Correlation of median observed fraction ϵ
of Lyman-α
emission with large-scale overdensity δ
(top left), velocity along the line of sight v (bottom left), and their respective derivatives with respect to the line of sight
![]() /
/![]() (top right/bottom right) for different redshifts. In the lower-right panel, we show the quartile range for illustration. The scatter in the other panels is of similar magnitude.
(top right/bottom right) for different redshifts. In the lower-right panel, we show the quartile range for illustration. The scatter in the other panels is of similar magnitude.
Current usage metrics show cumulative count of Article Views (full-text article views including HTML views, PDF and ePub downloads, according to the available data) and Abstracts Views on Vision4Press platform.
Data correspond to usage on the plateform after 2015. The current usage metrics is available 48-96 hours after online publication and is updated daily on week days.
Initial download of the metrics may take a while.