Fig. 7
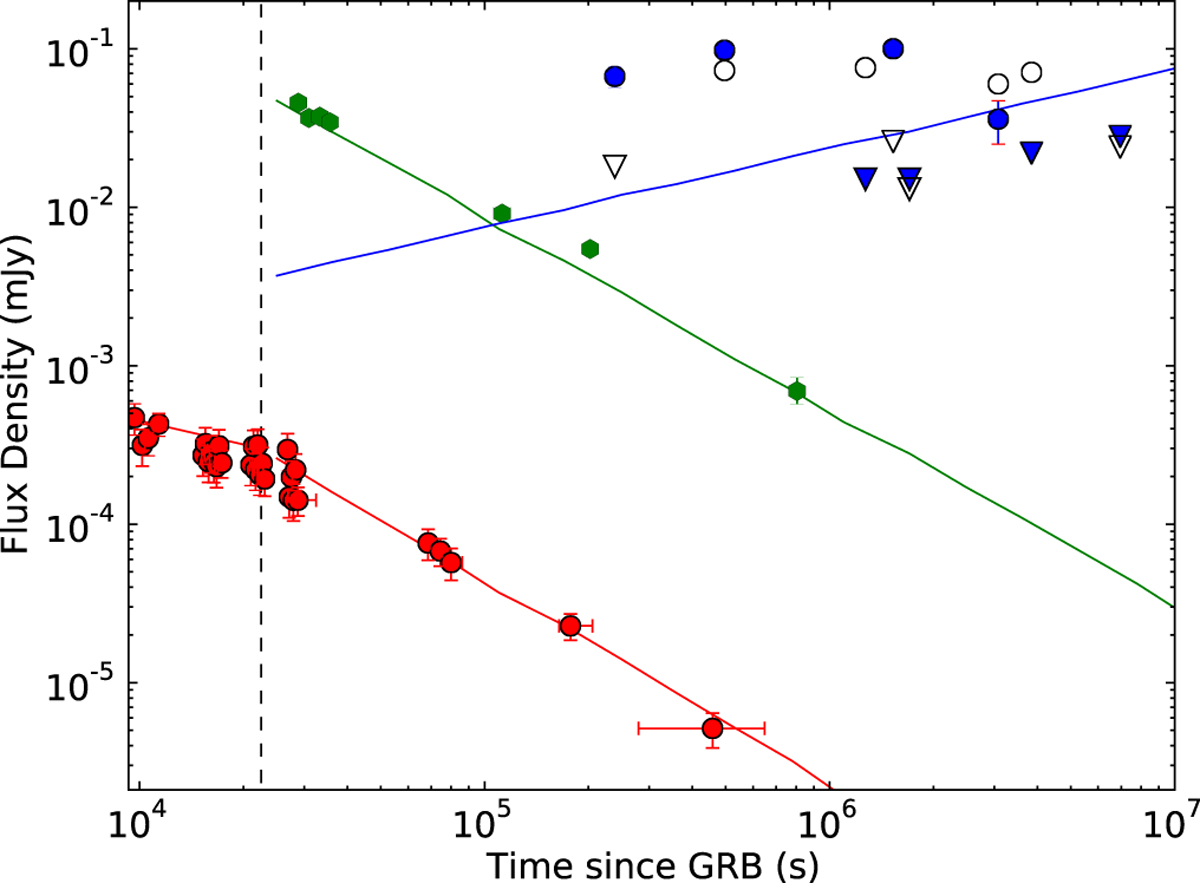
Model light curves for the afterglow of GRB 151027B at X-rays (red), optical (green, extinction-corrected), and radio (blue; open and filled symbols are 5.5 and 9 GHz, respectively; circles = detection, triangles = upper limits) for the lowest-Ekin parameter set. Data are drawn with error bars, which are mostly smaller than the symbol size. The vertical line denotes the break time of 22.5 ks (see Sect. 3.2). Radio data have not been used in deriving the model, so the blue curve is actually a “predicted” light curve.
Current usage metrics show cumulative count of Article Views (full-text article views including HTML views, PDF and ePub downloads, according to the available data) and Abstracts Views on Vision4Press platform.
Data correspond to usage on the plateform after 2015. The current usage metrics is available 48-96 hours after online publication and is updated daily on week days.
Initial download of the metrics may take a while.