Free Access
Fig. 5
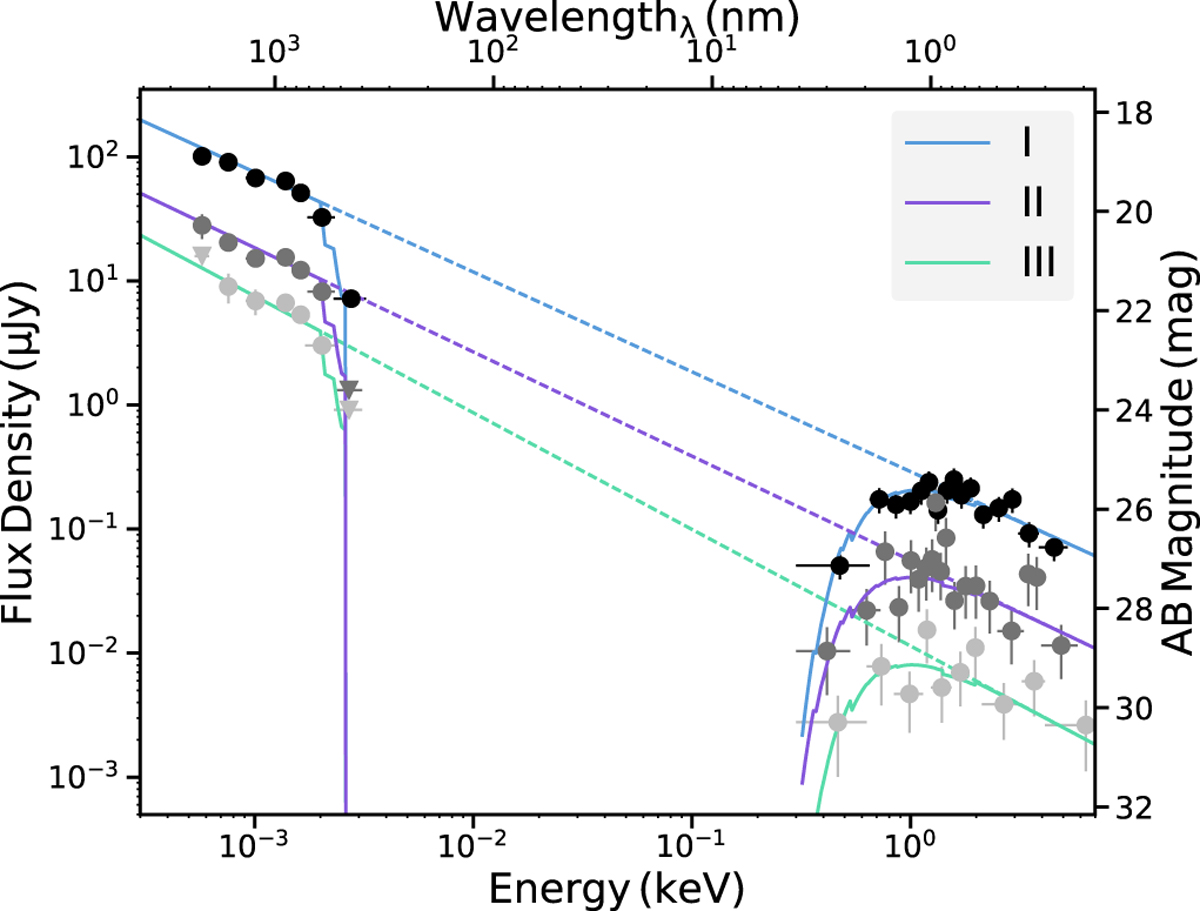
Observer-frame optical–NIR to X-ray spectral energy distribution of the afterglow of GRB 151027B at the three epochs marked in Fig. 4 with the gray shading. Error bars are plotted, but are mostly smaller than the symbol size.
Current usage metrics show cumulative count of Article Views (full-text article views including HTML views, PDF and ePub downloads, according to the available data) and Abstracts Views on Vision4Press platform.
Data correspond to usage on the plateform after 2015. The current usage metrics is available 48-96 hours after online publication and is updated daily on week days.
Initial download of the metrics may take a while.