Fig. 4
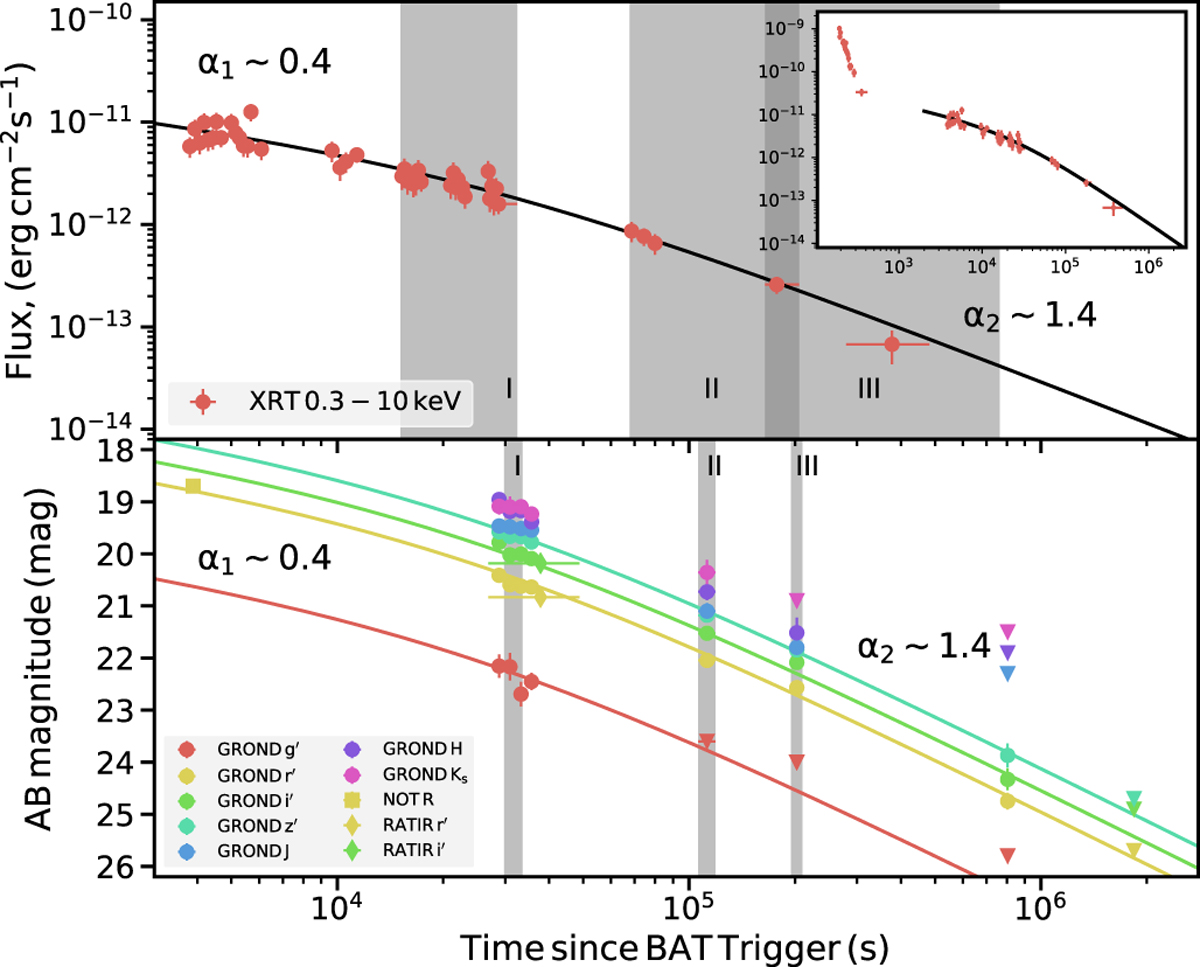
Light curve of the afterglow of GRB 151027B at X-rays as observed with Swift/XRT (top), and in the optical–NIR as observed with GROND (no extinction-correction applied), complemented with two measurements by NOT and RATIR (Malesani et al. 2015; Watson et al. 2015). Error bars are plotted, but are mostly smaller than the symbol size. The vertical gray bands mark the time intervals for which the spectral energy distributions have been established (see text for more details, and Fig. 5).
Current usage metrics show cumulative count of Article Views (full-text article views including HTML views, PDF and ePub downloads, according to the available data) and Abstracts Views on Vision4Press platform.
Data correspond to usage on the plateform after 2015. The current usage metrics is available 48-96 hours after online publication and is updated daily on week days.
Initial download of the metrics may take a while.