Fig. 2
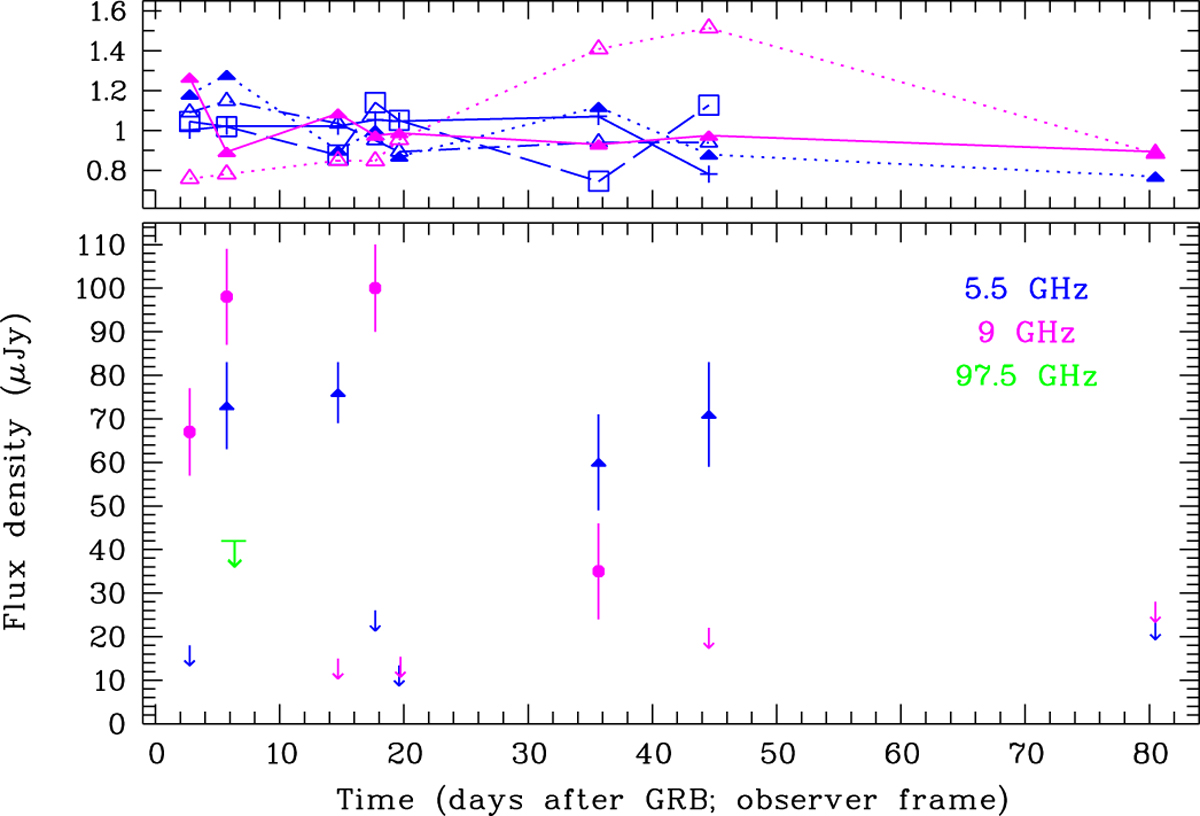
Radio light curve of the afterglow of GRB 151027B at 5.5 and 9 GHz, with the ALMA 97.5 GHz 2σ upper limitoverplotted (lower panel). The upper panel shows the measured fluxes of selected brighter (130–500 μJy) sources. While their nature or intrinsic variability is not known, their <20% flux variation demonstrates that the strong fluctuations seen for the GRB 151027B afterglow (which would correspond to an amplitude between 0.2 and 2 in this graph) is not an instrumental artifact.
Current usage metrics show cumulative count of Article Views (full-text article views including HTML views, PDF and ePub downloads, according to the available data) and Abstracts Views on Vision4Press platform.
Data correspond to usage on the plateform after 2015. The current usage metrics is available 48-96 hours after online publication and is updated daily on week days.
Initial download of the metrics may take a while.