Fig. 3
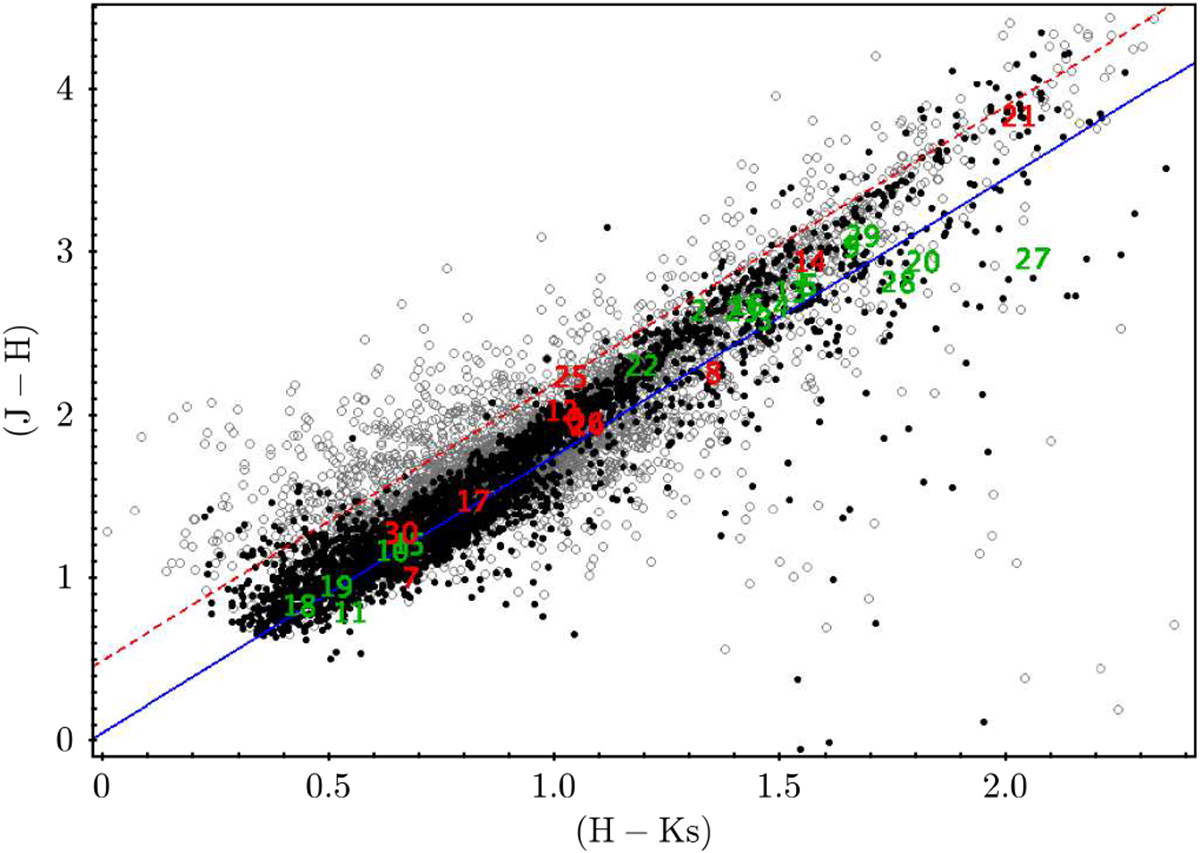
Colour–colour diagram for Masgomas-6. Black dots show the position of the most probable cluster members, and grey symbols show the position of the field stars. Objects with spectroscopic data are shown: massive stars (in green) and late-type giants (in red). In the figure we included the projection, following the extinction law by Rieke et al. (1989) (with R = 3.09; Rieke & Lebofsky 1985), for an O giant (blue solid line; intrinsic colour by Martins & Plez 2006) and a G5 giant (red dashedline; intrinsic colour by Cox 2000). The stellar population located above the red-dashed line corresponds mostly to the disc giant population and is observed only in the grey-field stars. The massive star population, confirmed spectroscopically, is observed close to the blue solid line and below the giant sequence.
Current usage metrics show cumulative count of Article Views (full-text article views including HTML views, PDF and ePub downloads, according to the available data) and Abstracts Views on Vision4Press platform.
Data correspond to usage on the plateform after 2015. The current usage metrics is available 48-96 hours after online publication and is updated daily on week days.
Initial download of the metrics may take a while.