Fig. 2
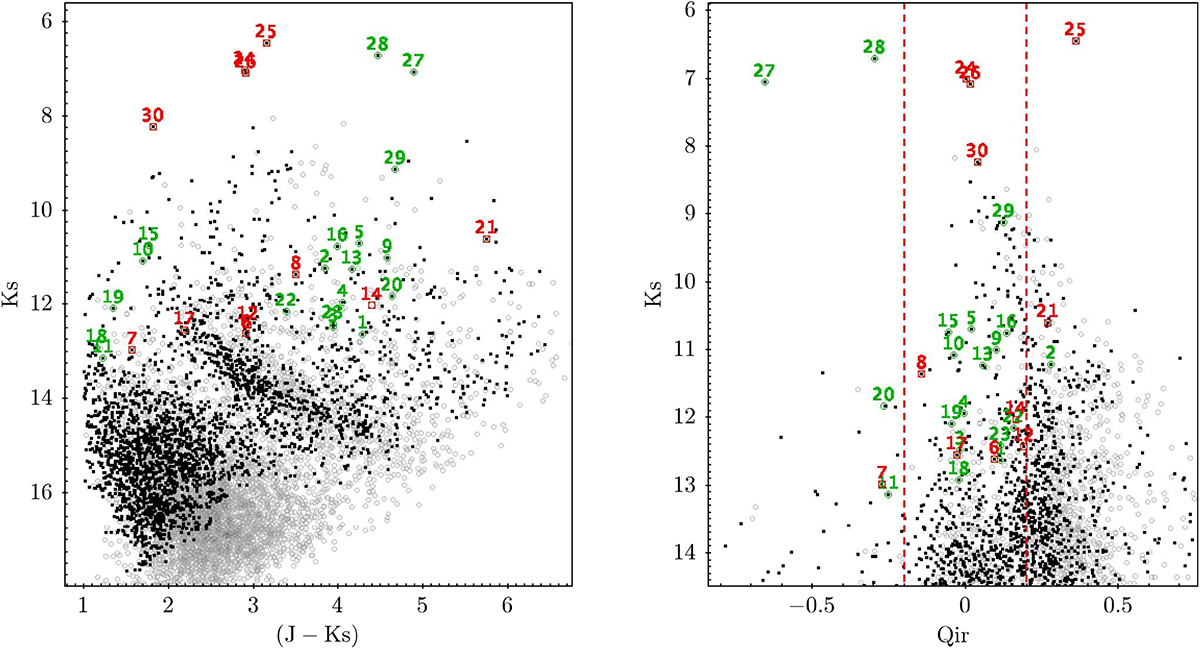
Colour–magnitude (left) and free-reddening parameter–magnitude QIR (right) diagrams for Masgomas-6. Black dots show the position of the most probable cluster members, and grey symbols show the position of the field stars. We include in the figure the spectroscopically confirmed massive stars with green open squares and the late-type giant stars with red open circles. The individual identification numbers (ID, Table A.1) are also shown above each coloured symbol. In the pseudocolour–magnitude diagram, we can see that most of the massive stars are found between QIR values of –0.2 and 0.2, as expected from our selection method.
Current usage metrics show cumulative count of Article Views (full-text article views including HTML views, PDF and ePub downloads, according to the available data) and Abstracts Views on Vision4Press platform.
Data correspond to usage on the plateform after 2015. The current usage metrics is available 48-96 hours after online publication and is updated daily on week days.
Initial download of the metrics may take a while.