Fig. 7
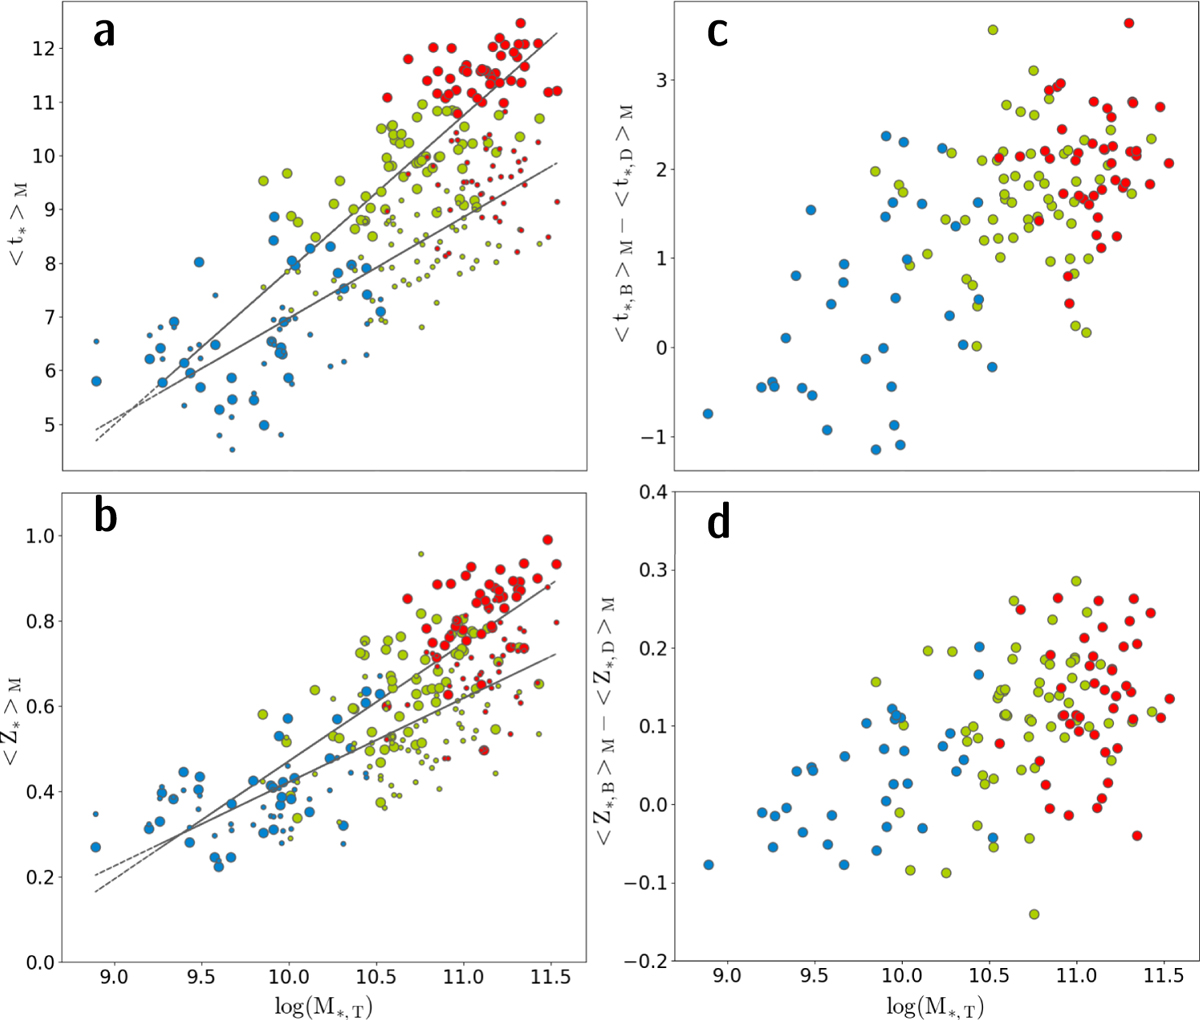
Panel a: logarithm of the total stellar mass ![]() (M⊙) vs. mass-weighted stellar age
(M⊙) vs. mass-weighted stellar age ![]() (Gyr) of the bulge and disk component (large and small dots, respectively). Linear fits to the data for the bulge and the disk are shown with solid lines. The color coding is the same as in Fig. 6. Panel b: log(
(Gyr) of the bulge and disk component (large and small dots, respectively). Linear fits to the data for the bulge and the disk are shown with solid lines. The color coding is the same as in Fig. 6. Panel b: log(![]() ) vs. mass-weighted stellar metallicity (Z⊙) for the bulge and the disk. The layout is identical to that in panel a. Panel c: log(
) vs. mass-weighted stellar metallicity (Z⊙) for the bulge and the disk. The layout is identical to that in panel a. Panel c: log(![]() ) vs. age contrast δtBD (
) vs. age contrast δtBD (![]() –
–
![]() ) (Gyr) between bulge and disk. Panel d: log(
) (Gyr) between bulge and disk. Panel d: log(![]() ) vs. metallicity contrast δZBD (
) vs. metallicity contrast δZBD (![]() –
–
![]() ) in Z⊙ between bulge and disk.
) in Z⊙ between bulge and disk.
Current usage metrics show cumulative count of Article Views (full-text article views including HTML views, PDF and ePub downloads, according to the available data) and Abstracts Views on Vision4Press platform.
Data correspond to usage on the plateform after 2015. The current usage metrics is available 48-96 hours after online publication and is updated daily on week days.
Initial download of the metrics may take a while.