Fig. 6
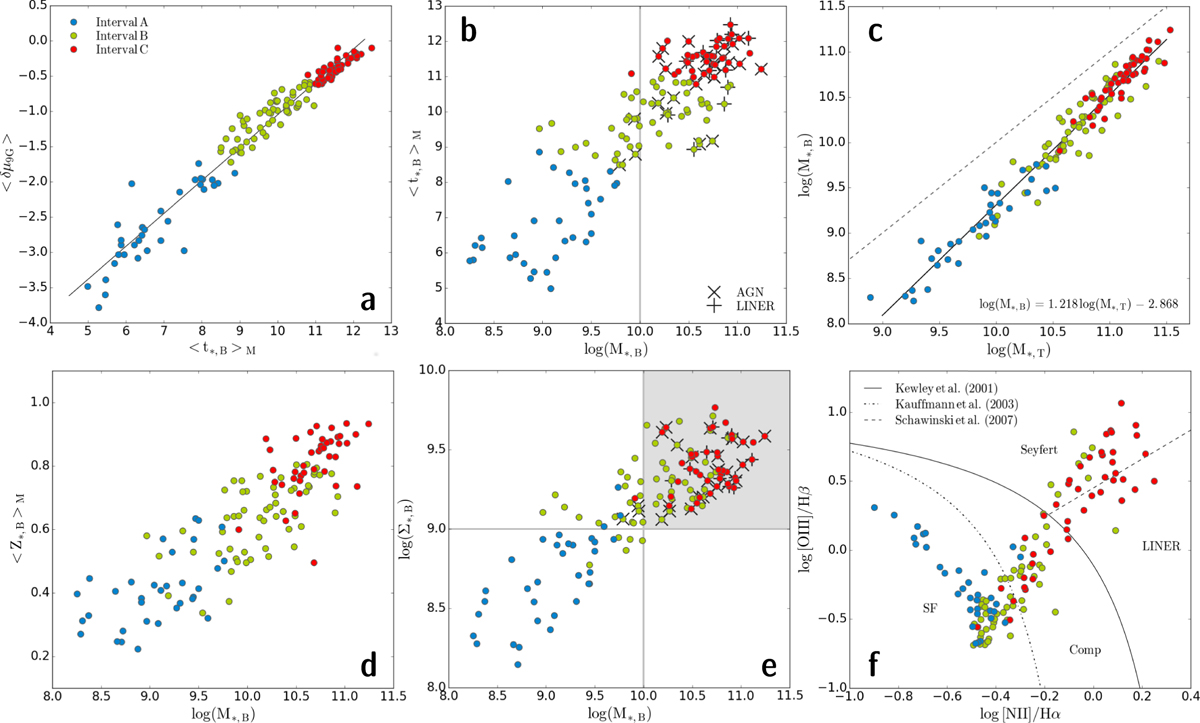
Panel a: ⟨δμ9G⟩ (r mag) vs. mass-weighted stellar age ![]() (Gyr) for the bulgecomponent of our sample LTGs. The solid line shows a linear fit to the data. Panel b: logarithm of the stellar mass
(Gyr) for the bulgecomponent of our sample LTGs. The solid line shows a linear fit to the data. Panel b: logarithm of the stellar mass ![]() (M⊙) in the bulge vs. mass-weighted stellar age
(M⊙) in the bulge vs. mass-weighted stellar age ![]() (Gyr). Galaxies spectroscopically classified as Seyfert and LINER are marked. Panel c: total stellar mass
(Gyr). Galaxies spectroscopically classified as Seyfert and LINER are marked. Panel c: total stellar mass
![]() vs.
vs.
![]() . The solid and dashed lines show, respectively, a linear fit to the data and equality between both quantities. Panel d: logarithm of
. The solid and dashed lines show, respectively, a linear fit to the data and equality between both quantities. Panel d: logarithm of ![]() vs. mass-weighted stellar metallicity
vs. mass-weighted stellar metallicity ![]() (Z⊙).
Panel e: logarithm of
(Z⊙).
Panel e: logarithm of ![]() vs. logarithm of the mean stellar surface density Σ⋆,B (M⊙ kpc−2) in the bulge. The gray-shaded quadrant at log
vs. logarithm of the mean stellar surface density Σ⋆,B (M⊙ kpc−2) in the bulge. The gray-shaded quadrant at log ![]() 10 and log Σ⋆,B ≥ 9 delineates the parameter space containing 93% of all Seyfert and LINER galaxies in our sample. Panel f: spectroscopic classification after BPT within simulated 3′′ SDSS fibers (method a in Sect. 2.3; cf. Fig. 4).
10 and log Σ⋆,B ≥ 9 delineates the parameter space containing 93% of all Seyfert and LINER galaxies in our sample. Panel f: spectroscopic classification after BPT within simulated 3′′ SDSS fibers (method a in Sect. 2.3; cf. Fig. 4).
Current usage metrics show cumulative count of Article Views (full-text article views including HTML views, PDF and ePub downloads, according to the available data) and Abstracts Views on Vision4Press platform.
Data correspond to usage on the plateform after 2015. The current usage metrics is available 48-96 hours after online publication and is updated daily on week days.
Initial download of the metrics may take a while.