Fig. 5
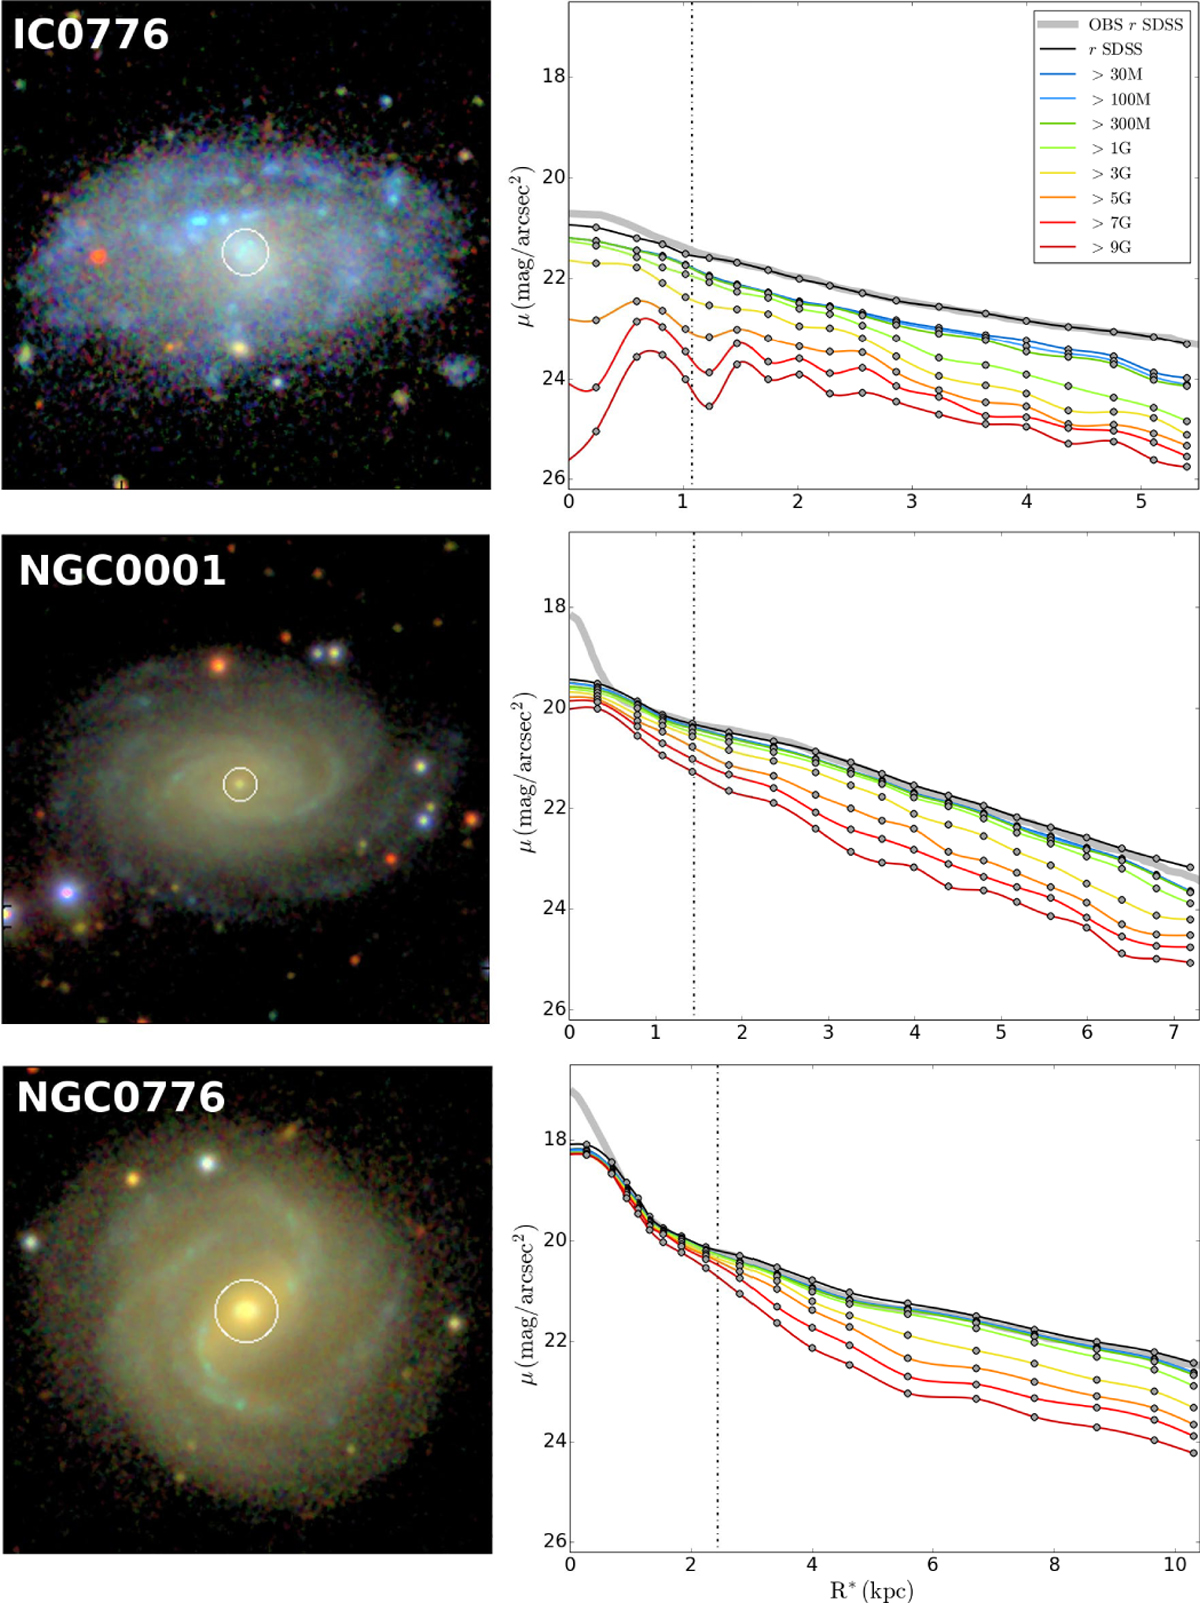
SDSS true-color images and SBPs (left- and right-side panels, respectively) for three LTGs illustrating the prominence of the bulge relatively to the disk for the three
⟨δμ9G ⟩ intervals tentatively defined in Sect. 3: IC 0776 (log ![]() = 9.58; interval iA), NGC 0001 (log
= 9.58; interval iA), NGC 0001 (log ![]() = 10.99; interval iB) and NGC 0776 (log
= 10.99; interval iB) and NGC 0776 (log ![]() = 11.09; interval iC). Synthetic SBPs computed through convolution of the observed IFS data with the SDSS
r-band filter transmission curve are shown in black, and those after removal with
= 11.09; interval iC). Synthetic SBPs computed through convolution of the observed IFS data with the SDSS
r-band filter transmission curve are shown in black, and those after removal with
![]() of stellar populations younger than 0.03, 0.1, 0.3, 1, 3, 5, 7 and 9 Gyr with the color coding in the upper-right panel. Thick-gray curves depict r-band SBPs computed from SDSS images and used for fitting a Sérsic model to infer the bulge radius
RB (dashed vertical lines). The circles overlaid with SDSS images depict the bulge diameter.
of stellar populations younger than 0.03, 0.1, 0.3, 1, 3, 5, 7 and 9 Gyr with the color coding in the upper-right panel. Thick-gray curves depict r-band SBPs computed from SDSS images and used for fitting a Sérsic model to infer the bulge radius
RB (dashed vertical lines). The circles overlaid with SDSS images depict the bulge diameter.
Current usage metrics show cumulative count of Article Views (full-text article views including HTML views, PDF and ePub downloads, according to the available data) and Abstracts Views on Vision4Press platform.
Data correspond to usage on the plateform after 2015. The current usage metrics is available 48-96 hours after online publication and is updated daily on week days.
Initial download of the metrics may take a while.