Fig. 4
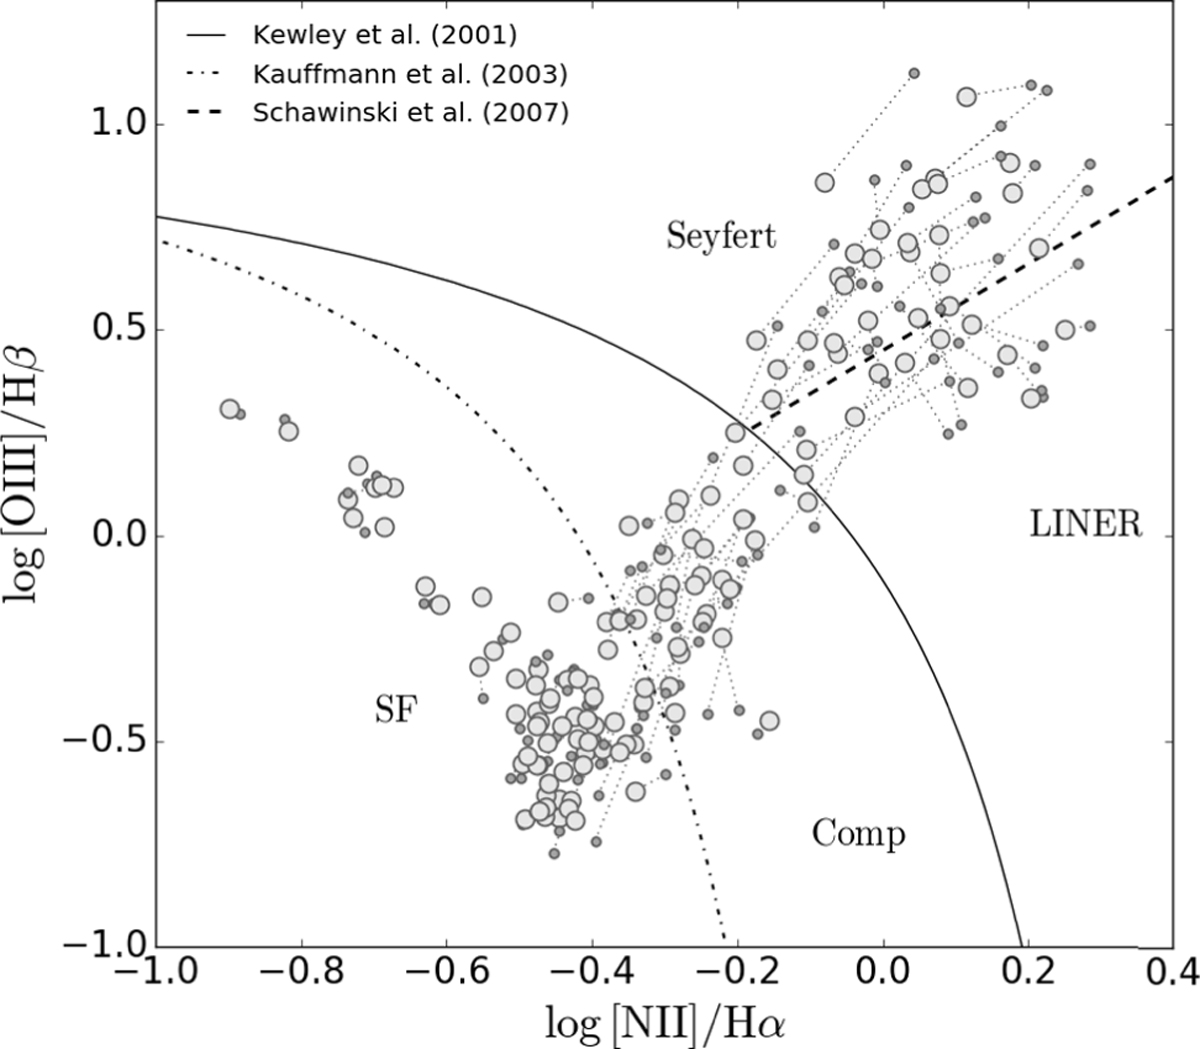
Comparison of diagnostic emission-line ratios after Baldwin et al. (1981), as obtained within a 3′′ aperture (small circles; method a), connected by dotted lines with determinations from method b (mean ratios within RB from radial [OIII]/Hβ and [NII]/Hα profiles; big circles). Data based on method c (luminosity-weighted determinations using integral [OIII]5007, Hβ, [NII]6584 and Hα line fluxes within RB) and error bars are omitted for the sake of better visibility.The loci of Seyfert, LINERs and Composites, and that corresponding to photoionization by SF are demarcated following Kauffmann et al. (2003b, dashed-dotted curve), Kewley et al. (2001, solid curve) and Schawinski et al. (2007, dashed line).
Current usage metrics show cumulative count of Article Views (full-text article views including HTML views, PDF and ePub downloads, according to the available data) and Abstracts Views on Vision4Press platform.
Data correspond to usage on the plateform after 2015. The current usage metrics is available 48-96 hours after online publication and is updated daily on week days.
Initial download of the metrics may take a while.