Fig. B.1
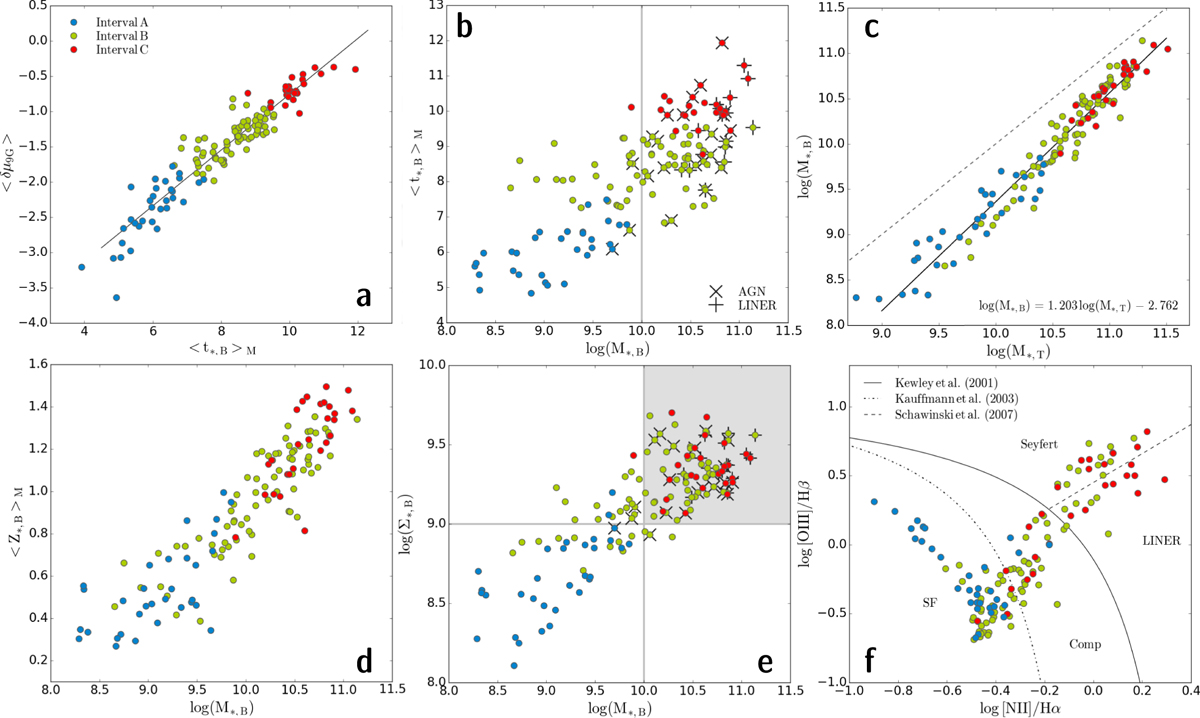
Main results from the spectral fitting of the LTG sample with the SSP base Z5 (cf. Sect. 2.2.2). The color coding and the meaning of the individual panels is as in Fig. 6. Panel a:
⟨δμ9G ⟩ (r
mag) vs. mass-weighted stellar age ![]() (Gyr) for the bulge component, with the solid line showing a linear fit to the data. Panel b: logarithm of the stellar mass
(Gyr) for the bulge component, with the solid line showing a linear fit to the data. Panel b: logarithm of the stellar mass
![]() (M⊙) in the bulge vs. mass-weighted stellar age
(M⊙) in the bulge vs. mass-weighted stellar age ![]() (Gyr). Galaxies spectroscopically classified as Seyfert and LINER (cf. panel f) are marked. Panel c: total stellar mass
(Gyr). Galaxies spectroscopically classified as Seyfert and LINER (cf. panel f) are marked. Panel c: total stellar mass
![]() vs.
vs.
![]() . The solid and dashed lines show, respectively, a linear fit to the data and equality between both quantities. Panel d: Logarithm of
. The solid and dashed lines show, respectively, a linear fit to the data and equality between both quantities. Panel d: Logarithm of ![]() vs. mass-weighted stellar metallicity
vs. mass-weighted stellar metallicity ![]() .
Panel e: logarithm of
.
Panel e: logarithm of ![]() vs. logarithm of the mean stellar surface density Σ⋆,B (M⊙ kpc−2) in the bulge. Panel f: spectroscopic classification after BPT line ratios within simulated
3′′ SDSS fibers (cf. Sect. 2.3).
vs. logarithm of the mean stellar surface density Σ⋆,B (M⊙ kpc−2) in the bulge. Panel f: spectroscopic classification after BPT line ratios within simulated
3′′ SDSS fibers (cf. Sect. 2.3).
Current usage metrics show cumulative count of Article Views (full-text article views including HTML views, PDF and ePub downloads, according to the available data) and Abstracts Views on Vision4Press platform.
Data correspond to usage on the plateform after 2015. The current usage metrics is available 48-96 hours after online publication and is updated daily on week days.
Initial download of the metrics may take a while.