Fig. A.2
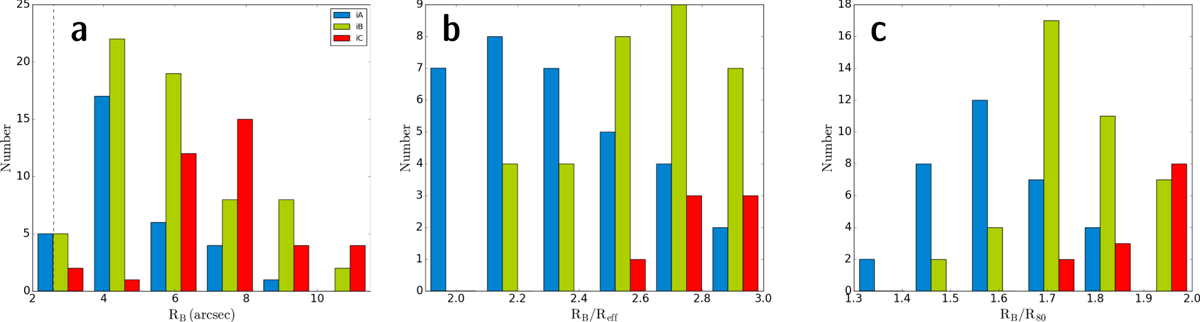
Histogram distributions of the bulge isophotal radius ![]() of the LTGs in our sample (panel a), and its normalized values to Reff and the radius enclosing 80% of its total bulge luminosity (panels b and c, respectively). The dashed vertical line in panel a marks the FWHM of CALIFA DR3 data (2. ′′ 6). The color coding is identical to that in Fig. 6 and is meant to illustrate the variation of the bulge extent among the three tentatively defined
⟨δμ9G ⟩ intervals (cf. Sect. 3).
of the LTGs in our sample (panel a), and its normalized values to Reff and the radius enclosing 80% of its total bulge luminosity (panels b and c, respectively). The dashed vertical line in panel a marks the FWHM of CALIFA DR3 data (2. ′′ 6). The color coding is identical to that in Fig. 6 and is meant to illustrate the variation of the bulge extent among the three tentatively defined
⟨δμ9G ⟩ intervals (cf. Sect. 3).
Current usage metrics show cumulative count of Article Views (full-text article views including HTML views, PDF and ePub downloads, according to the available data) and Abstracts Views on Vision4Press platform.
Data correspond to usage on the plateform after 2015. The current usage metrics is available 48-96 hours after online publication and is updated daily on week days.
Initial download of the metrics may take a while.