Free Access
Fig. 14
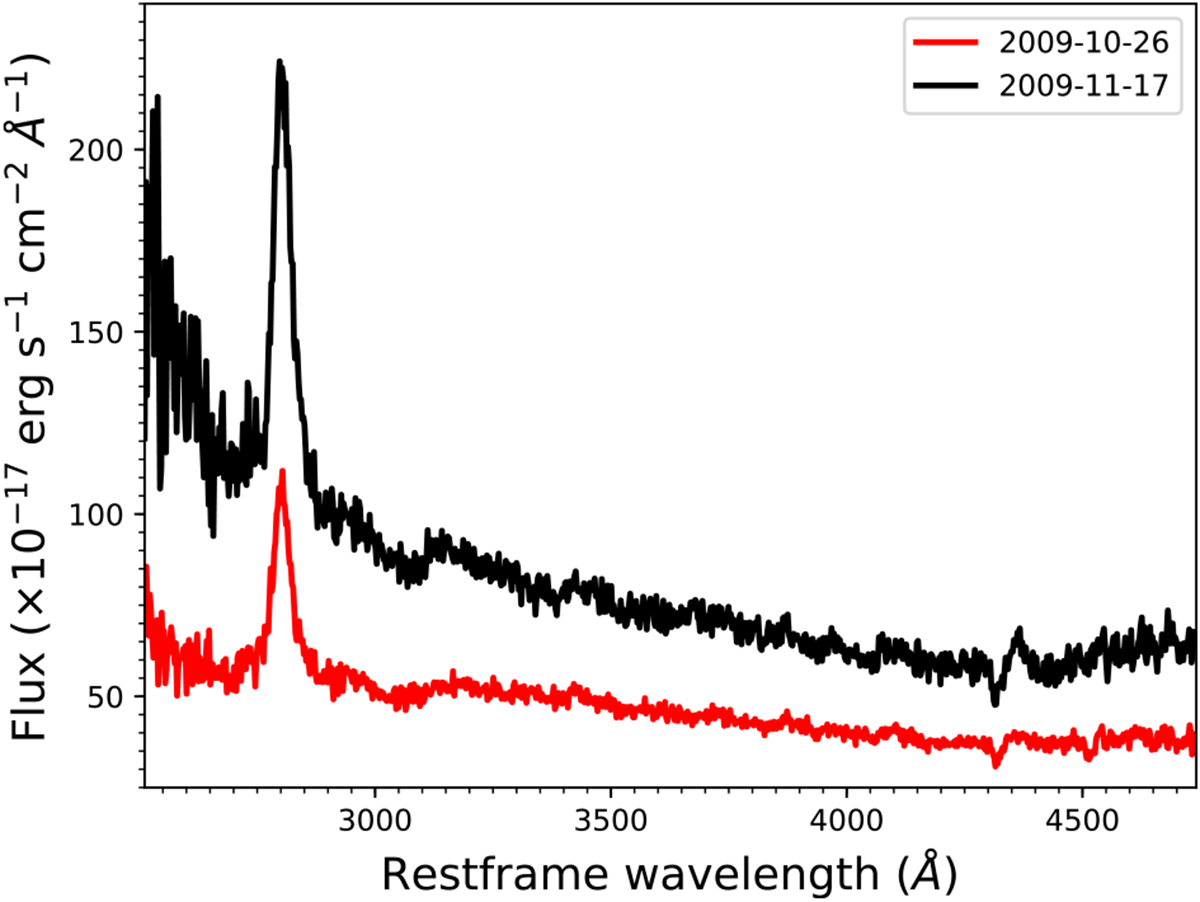
Optical spectra in restframe wavelength observed in two different days. The prominent emission line is Mg II λ2798. The red line indicates the spectrum observed on 2009-10-26, the black line indicates the spectrum obtained on 2009 November 17. Both spectra come from the public archive of Steward observatory.
Current usage metrics show cumulative count of Article Views (full-text article views including HTML views, PDF and ePub downloads, according to the available data) and Abstracts Views on Vision4Press platform.
Data correspond to usage on the plateform after 2015. The current usage metrics is available 48-96 hours after online publication and is updated daily on week days.
Initial download of the metrics may take a while.