Free Access
Fig. 12
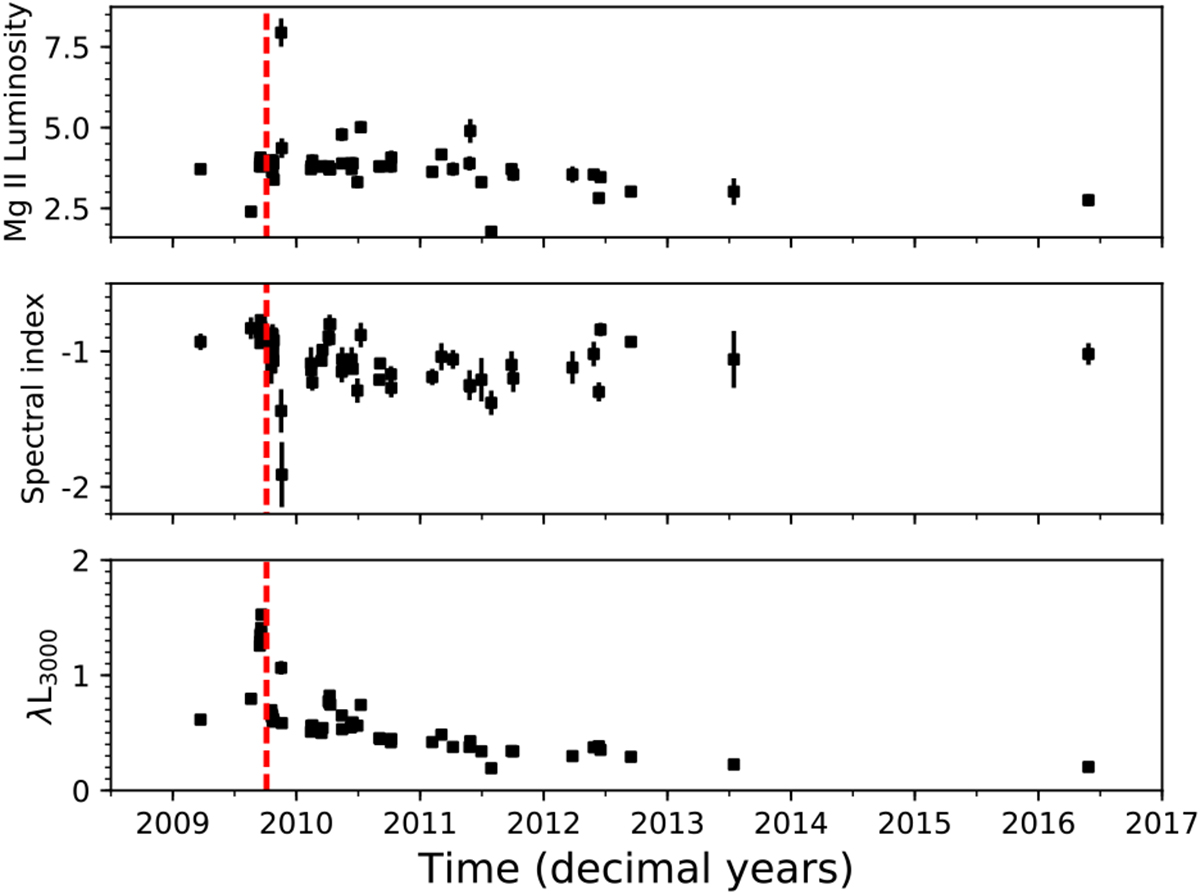
Top panel: light curve of the total Mg II λ2798 line flux. The flux is in units of 1042 erg s−1. Middle panel: time evolution of optical spectral index. Bottom panel: light curve of the 3000 Å continuum luminosity, in units of 1041 erg s−1. The red vertical dashed line in each plot indicates the 2009B flare.
Current usage metrics show cumulative count of Article Views (full-text article views including HTML views, PDF and ePub downloads, according to the available data) and Abstracts Views on Vision4Press platform.
Data correspond to usage on the plateform after 2015. The current usage metrics is available 48-96 hours after online publication and is updated daily on week days.
Initial download of the metrics may take a while.