Fig. 9
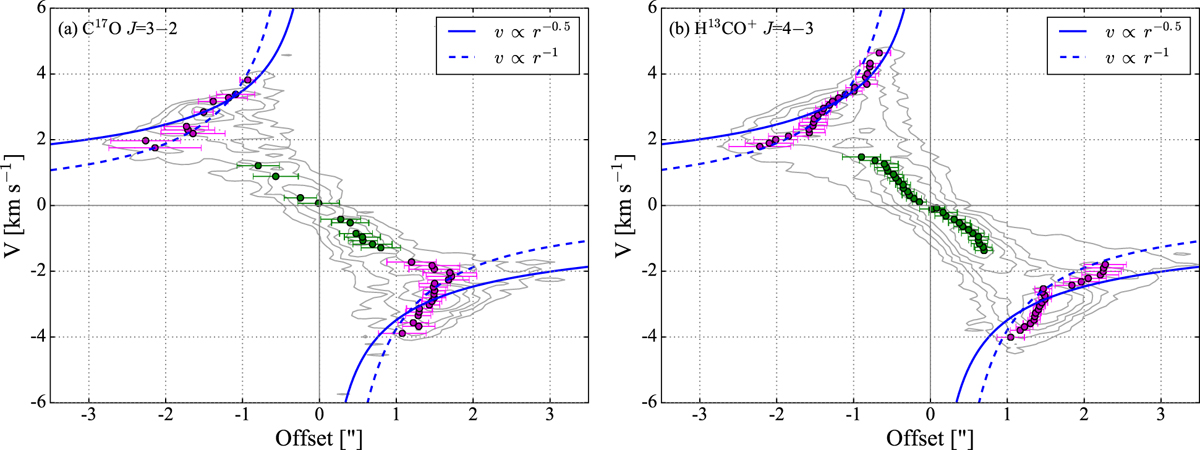
Position-velocity diagrams for C17O and H13CO+ towards the disk-like structure direction (PA = 234°) and centred at the position of the geometric centre. Green and magenta dots represent low- (<1.7 km s−1) and high-velocity (>1.7 km s−1) emission peaks, respectively. Blue solid and dashed lines show the best fit for a Keplerian and an infalling velocity profile, respectively. The cut taken from the image data is shown in grey contours, ranging from 3σ (1σ = 10 mJy beam−1) to the maximum value of each transition. Each adjacent contour represents an increment of the 20% of the maximum value.
Current usage metrics show cumulative count of Article Views (full-text article views including HTML views, PDF and ePub downloads, according to the available data) and Abstracts Views on Vision4Press platform.
Data correspond to usage on the plateform after 2015. The current usage metrics is available 48-96 hours after online publication and is updated daily on week days.
Initial download of the metrics may take a while.