Fig. 6
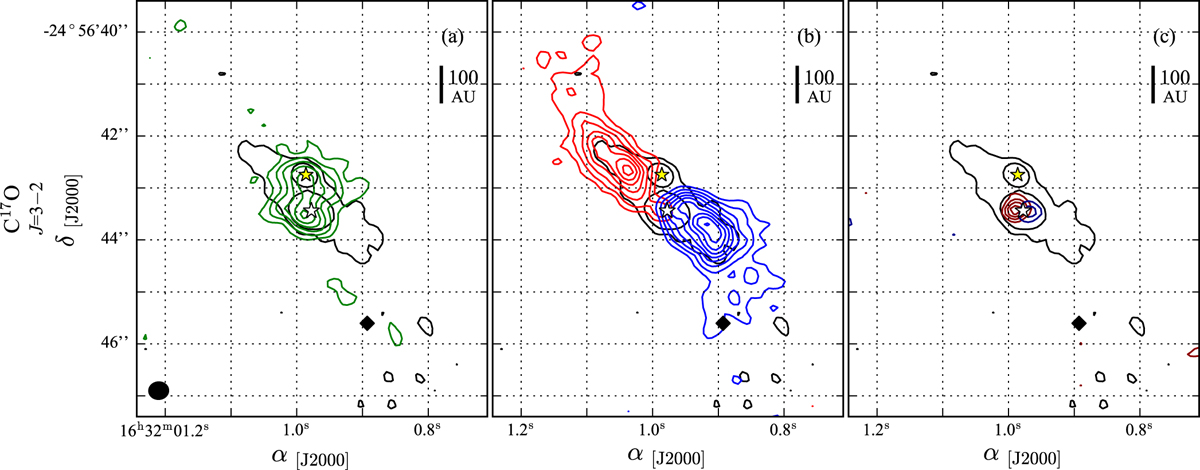
Channel maps for C17O, starting at 5σ (σ = 6 mJy beam−1 km s−1) and following a step of 4σ. Green contours represent low velocities emission, from −1 to 1 km s−1 (left). Blue and red contours indicate intermediate velocities, from −1 to −5 km s−1 and from 1 to 5 km s−1, respectively (middle). Dark-red and dark-blue contours show high-velocity emission, from −5 to −10 km s−1 and from 5 to 10 km s−1, respectively (right). The black contours represent the continuum emission of Fig. 1 for values of 4 and 15σ (σ = 0.4 mJy beam−1). The yellow and white stars indicate the position of Oph-IRS67A and B, respectively. The black diamond denotes the location of the high-density region. The synthesised beam is represented by a black filled ellipse.
Current usage metrics show cumulative count of Article Views (full-text article views including HTML views, PDF and ePub downloads, according to the available data) and Abstracts Views on Vision4Press platform.
Data correspond to usage on the plateform after 2015. The current usage metrics is available 48-96 hours after online publication and is updated daily on week days.
Initial download of the metrics may take a while.