Fig. 5
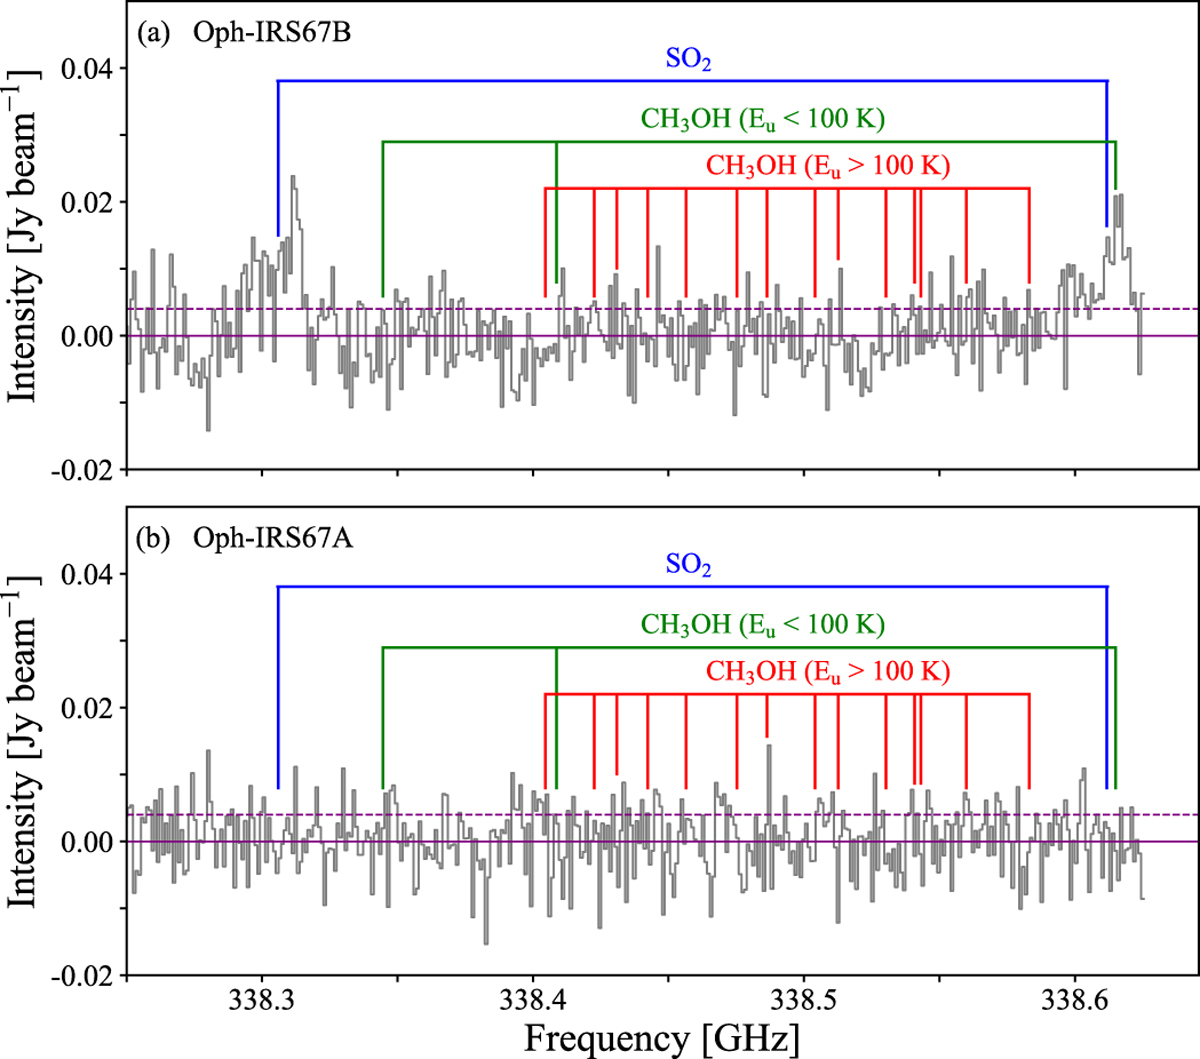
Spectra from spectral window number 2, taken at the position of Oph-IRS67B (top) and Oph-IRS67A (bottom), and rebinned by a factor of 4. Blue lines show the rest frequency of SO2 transitions. Green and red lines indicate the rest frequency of CH3OH transitions with upper energy levels (Eu) below and above 100 K, respectively. The purple dashed line shows the value of 1σ (σ = 4 mJy beam−1 per channel).
Current usage metrics show cumulative count of Article Views (full-text article views including HTML views, PDF and ePub downloads, according to the available data) and Abstracts Views on Vision4Press platform.
Data correspond to usage on the plateform after 2015. The current usage metrics is available 48-96 hours after online publication and is updated daily on week days.
Initial download of the metrics may take a while.