Fig. 4
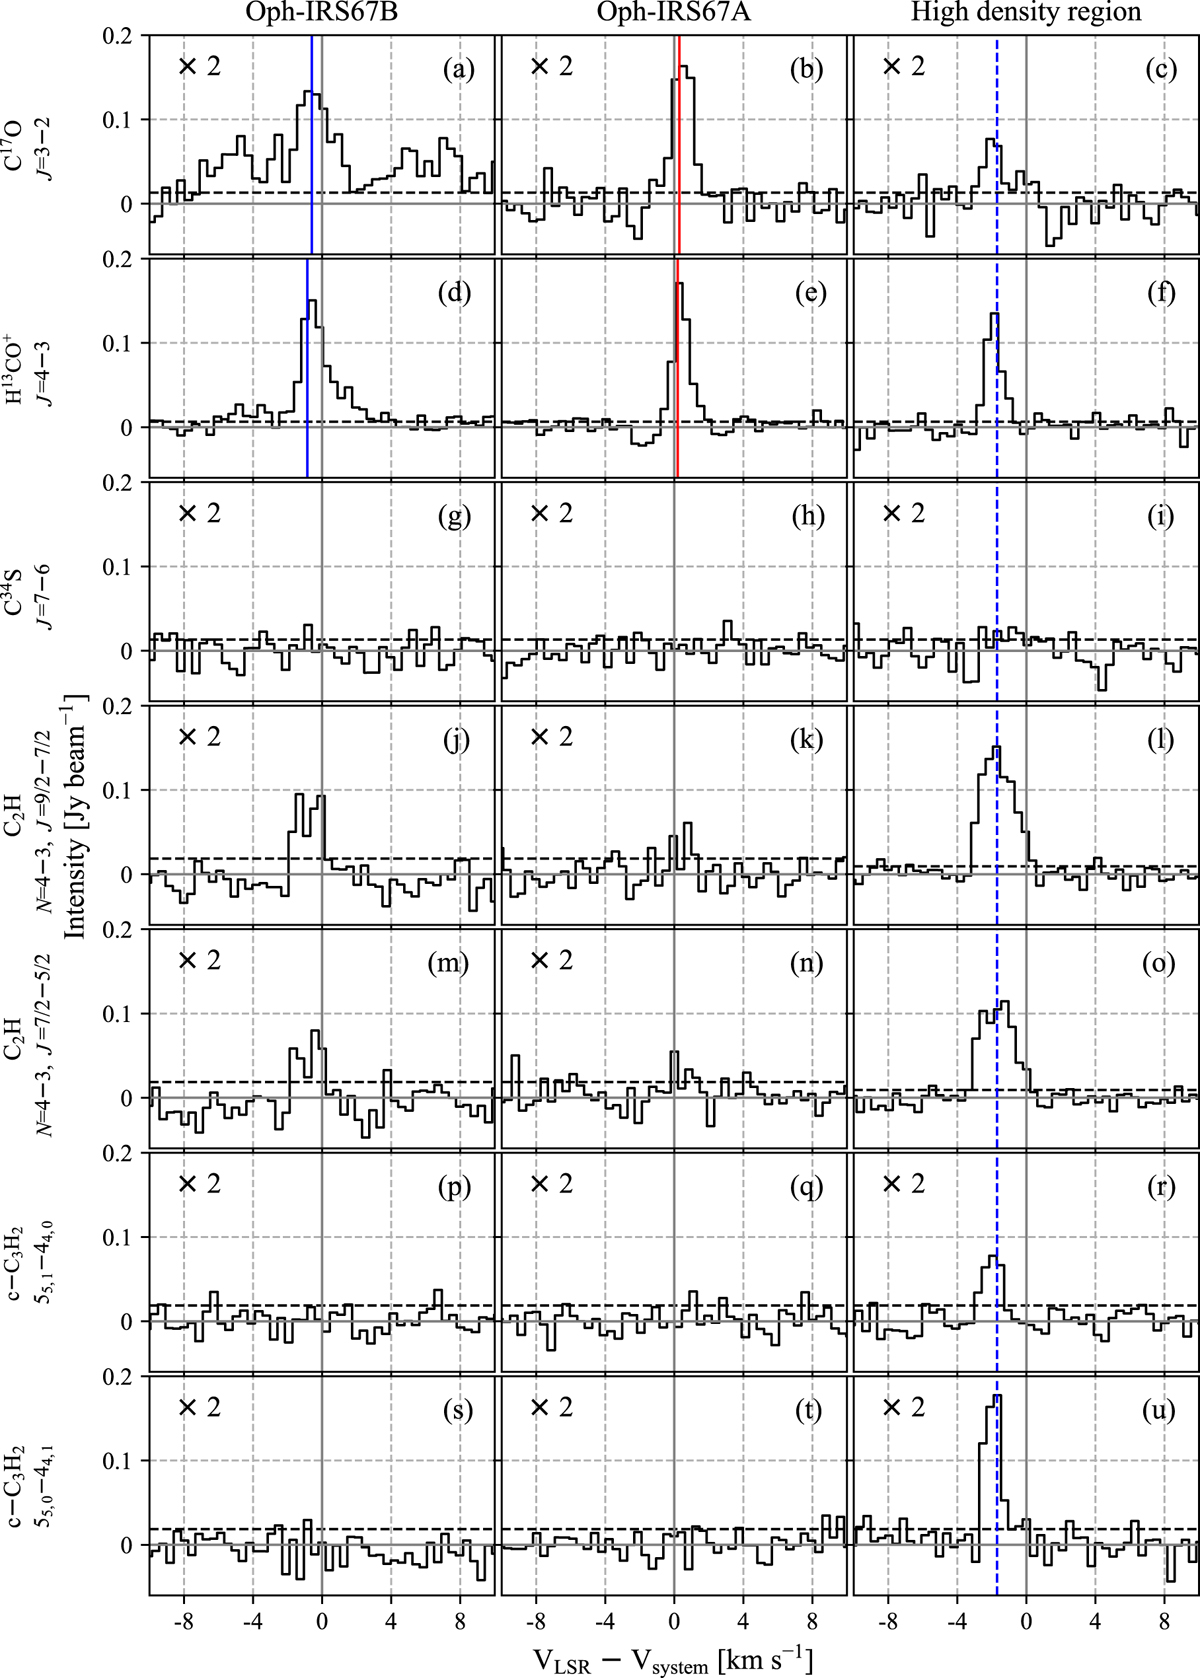
Spectra of C17O, H13CO+, C34S, both C2H doublets andboth c−C3H2 transitions for three different regions: the position of Oph-IRS67B (left column), the position of Oph-IRS67A (middle column) and the high-density region (right column). Spectra from panels a–i are rebinned spectrally by a factor of 4, while panels from j–u are rebinned spectrally by a factor of 2, so that all spectra have the same spectral resolution (0.43 km s−1). The dashed black horizontal line shows the value of 3σ (σ = 3 mJy beam−1 km s−1). All spectra have been shifted to the systemic velocity (4.2 km s−1; grey vertical line). The solid blue and red lines indicate the offset of the peak velocity determined from a Gaussian fit (see Table 4). The dashed blue line in the right column represents a velocity of −1.7 km s−1. Some spectra have been multiplied by a scaling factor as indicated in the top left corner.
Current usage metrics show cumulative count of Article Views (full-text article views including HTML views, PDF and ePub downloads, according to the available data) and Abstracts Views on Vision4Press platform.
Data correspond to usage on the plateform after 2015. The current usage metrics is available 48-96 hours after online publication and is updated daily on week days.
Initial download of the metrics may take a while.