Fig. 3
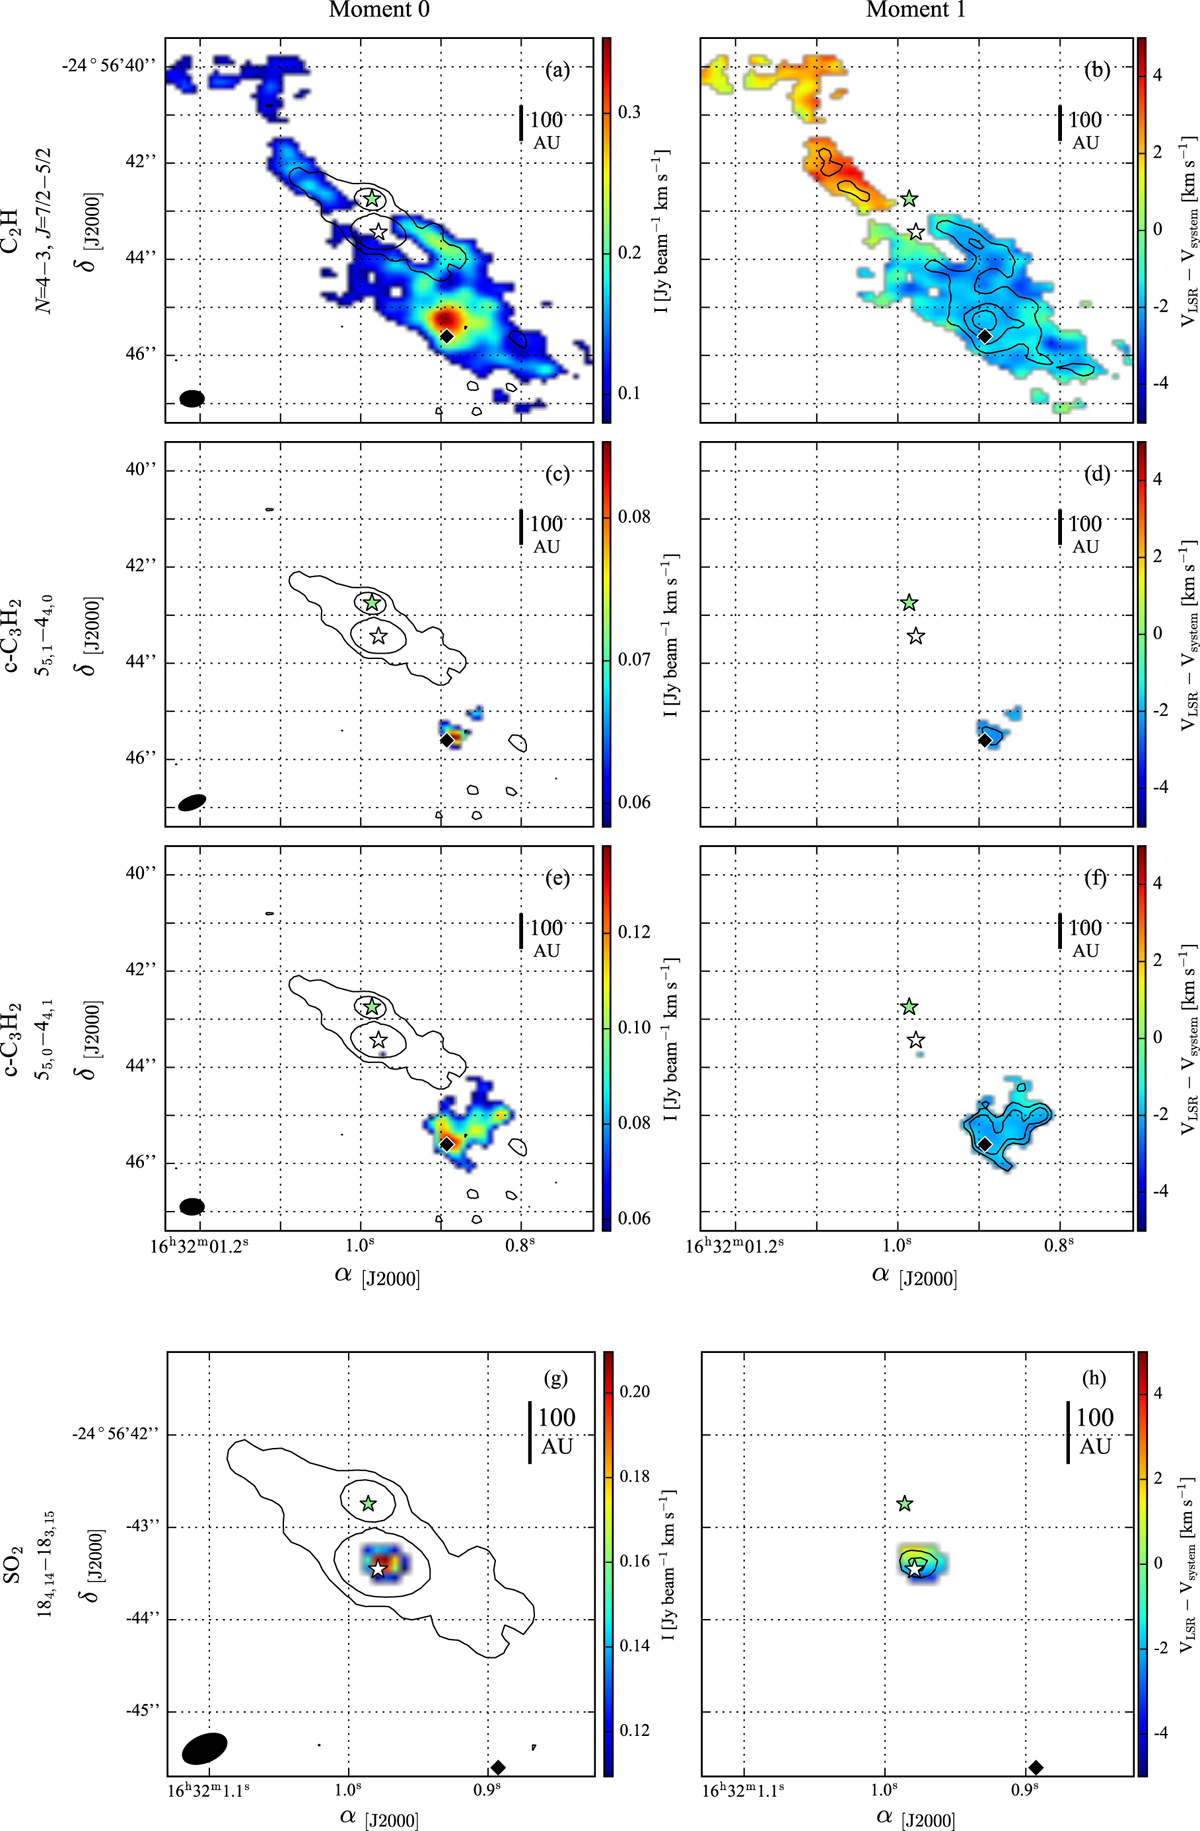
As in Fig. 2 but for the C2H N = 4 − 3, J = 7∕2− 5∕2 doublet, both c−C3H2 transitions and SO2 184,14 − 183,15 (![]() = 11 mJy beam−1 km s−1 and
= 11 mJy beam−1 km s−1 and ![]() = 25 mJy beam−1 km s−1). For SO2, the emission is above 4σ. Black contours in moment 1 maps represent 10, 15 and 20σ for C2 H, 6 and 8σ for c−C3H2, and 5 and 7σ for SO2. Panels g and h represent a zoomed-in region.
= 25 mJy beam−1 km s−1). For SO2, the emission is above 4σ. Black contours in moment 1 maps represent 10, 15 and 20σ for C2 H, 6 and 8σ for c−C3H2, and 5 and 7σ for SO2. Panels g and h represent a zoomed-in region.
Current usage metrics show cumulative count of Article Views (full-text article views including HTML views, PDF and ePub downloads, according to the available data) and Abstracts Views on Vision4Press platform.
Data correspond to usage on the plateform after 2015. The current usage metrics is available 48-96 hours after online publication and is updated daily on week days.
Initial download of the metrics may take a while.