Fig. 2
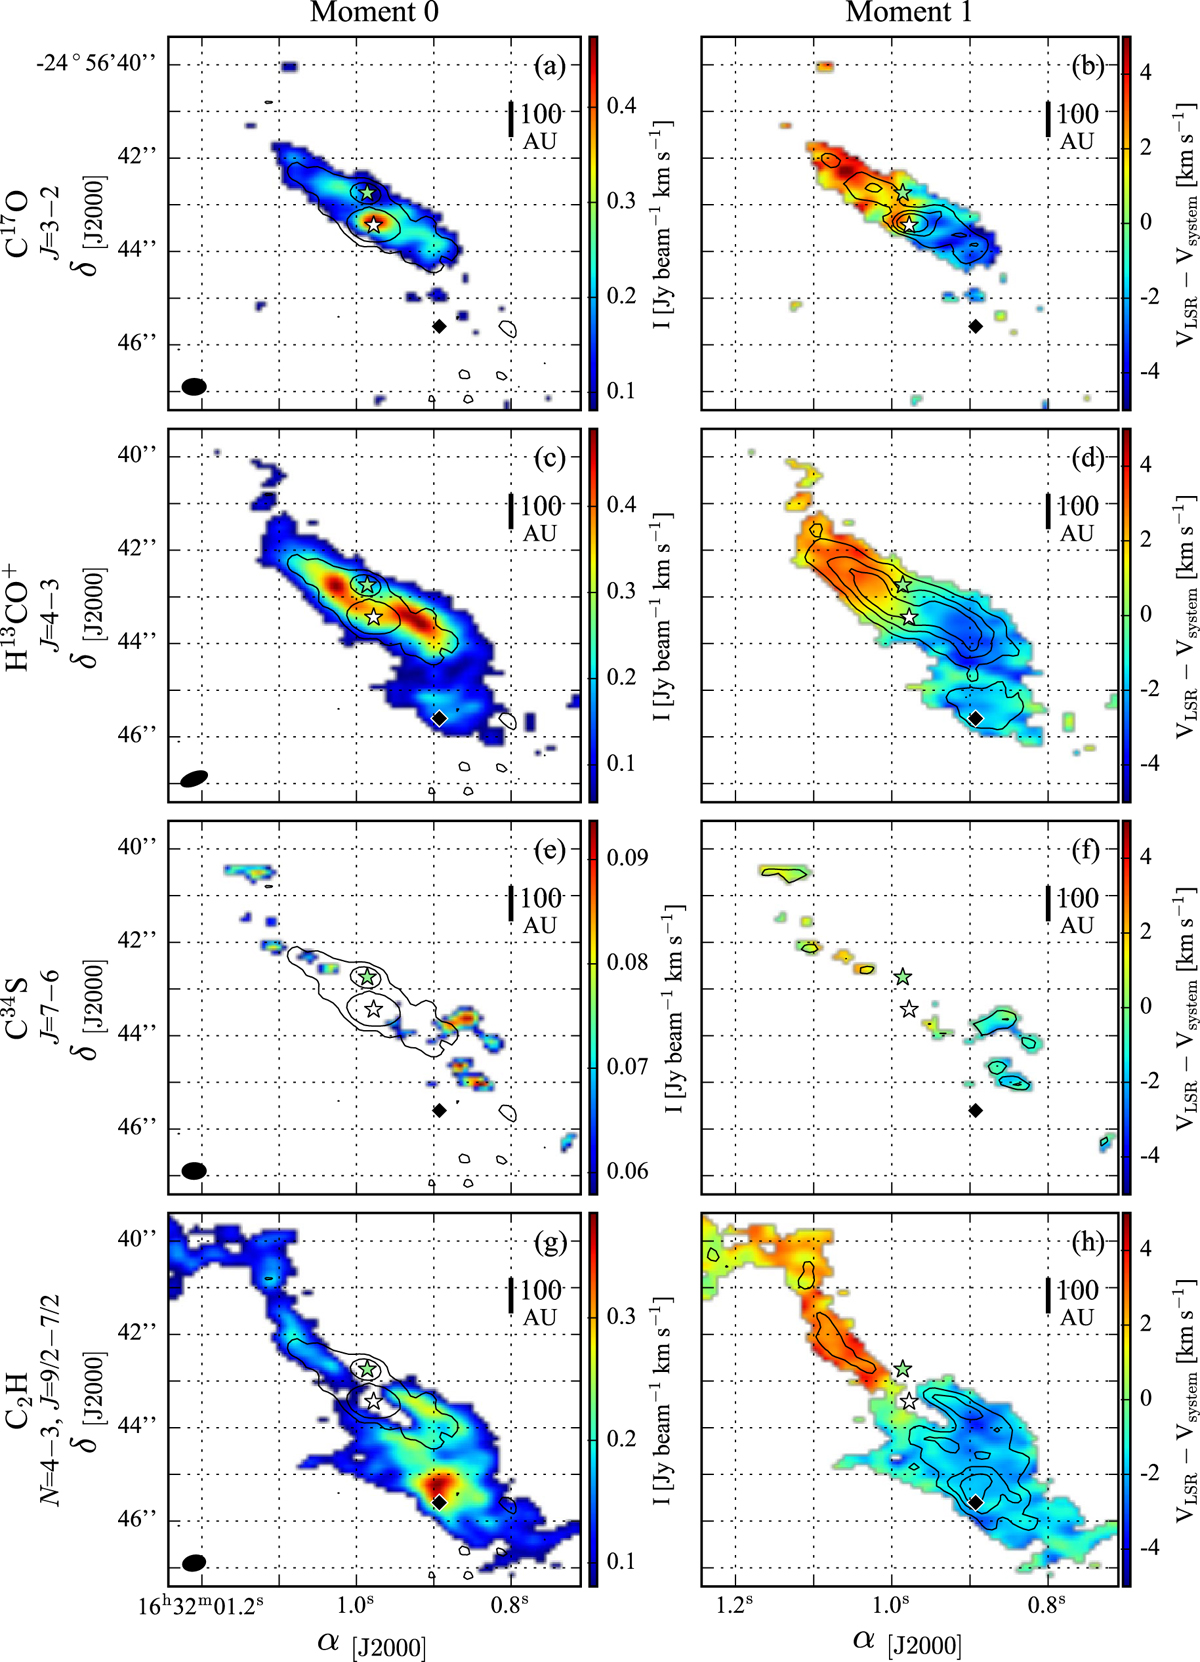
Moments 0 (left column) and 1 (right column) for C17O, H13CO+, C34S and the C2H
N = 4 − 3,
J = 9∕2− 7∕2 doublet, above 5σ
(![]() =15 mJy beam−1 km s−1,
=15 mJy beam−1 km s−1,
![]() = 10 mJy beam−1 km s−1,
= 10 mJy beam−1 km s−1,
![]() = 10 mJy beam−1 km s−1 and
= 10 mJy beam−1 km s−1 and ![]() = 15 mJy beam−1 km s−1). Each σ
was calculated using the following formula: σ = rms × ΔN × (N)0.5, where ΔN
and N are the channel width and number of channels, respectively. Black contours in moment 0 maps represent the continuum emission from Fig. 1, for values of 4 and 15σ. Black contours in moment 1 maps show σ
values of their respective moment 0 maps, being 10, 15 and 20σ
for C17O and C2 H, 10, 20 and 30σ
for H13CO+, and 6 and 8σ
for C34S. The green and white stars indicate the position of Oph-IRS67A and B, respectively. The black diamond denotes the location of the offset region. The synthesised beam for each species is represented by a black filled ellipse.
= 15 mJy beam−1 km s−1). Each σ
was calculated using the following formula: σ = rms × ΔN × (N)0.5, where ΔN
and N are the channel width and number of channels, respectively. Black contours in moment 0 maps represent the continuum emission from Fig. 1, for values of 4 and 15σ. Black contours in moment 1 maps show σ
values of their respective moment 0 maps, being 10, 15 and 20σ
for C17O and C2 H, 10, 20 and 30σ
for H13CO+, and 6 and 8σ
for C34S. The green and white stars indicate the position of Oph-IRS67A and B, respectively. The black diamond denotes the location of the offset region. The synthesised beam for each species is represented by a black filled ellipse.
Current usage metrics show cumulative count of Article Views (full-text article views including HTML views, PDF and ePub downloads, according to the available data) and Abstracts Views on Vision4Press platform.
Data correspond to usage on the plateform after 2015. The current usage metrics is available 48-96 hours after online publication and is updated daily on week days.
Initial download of the metrics may take a while.