Fig. A.1
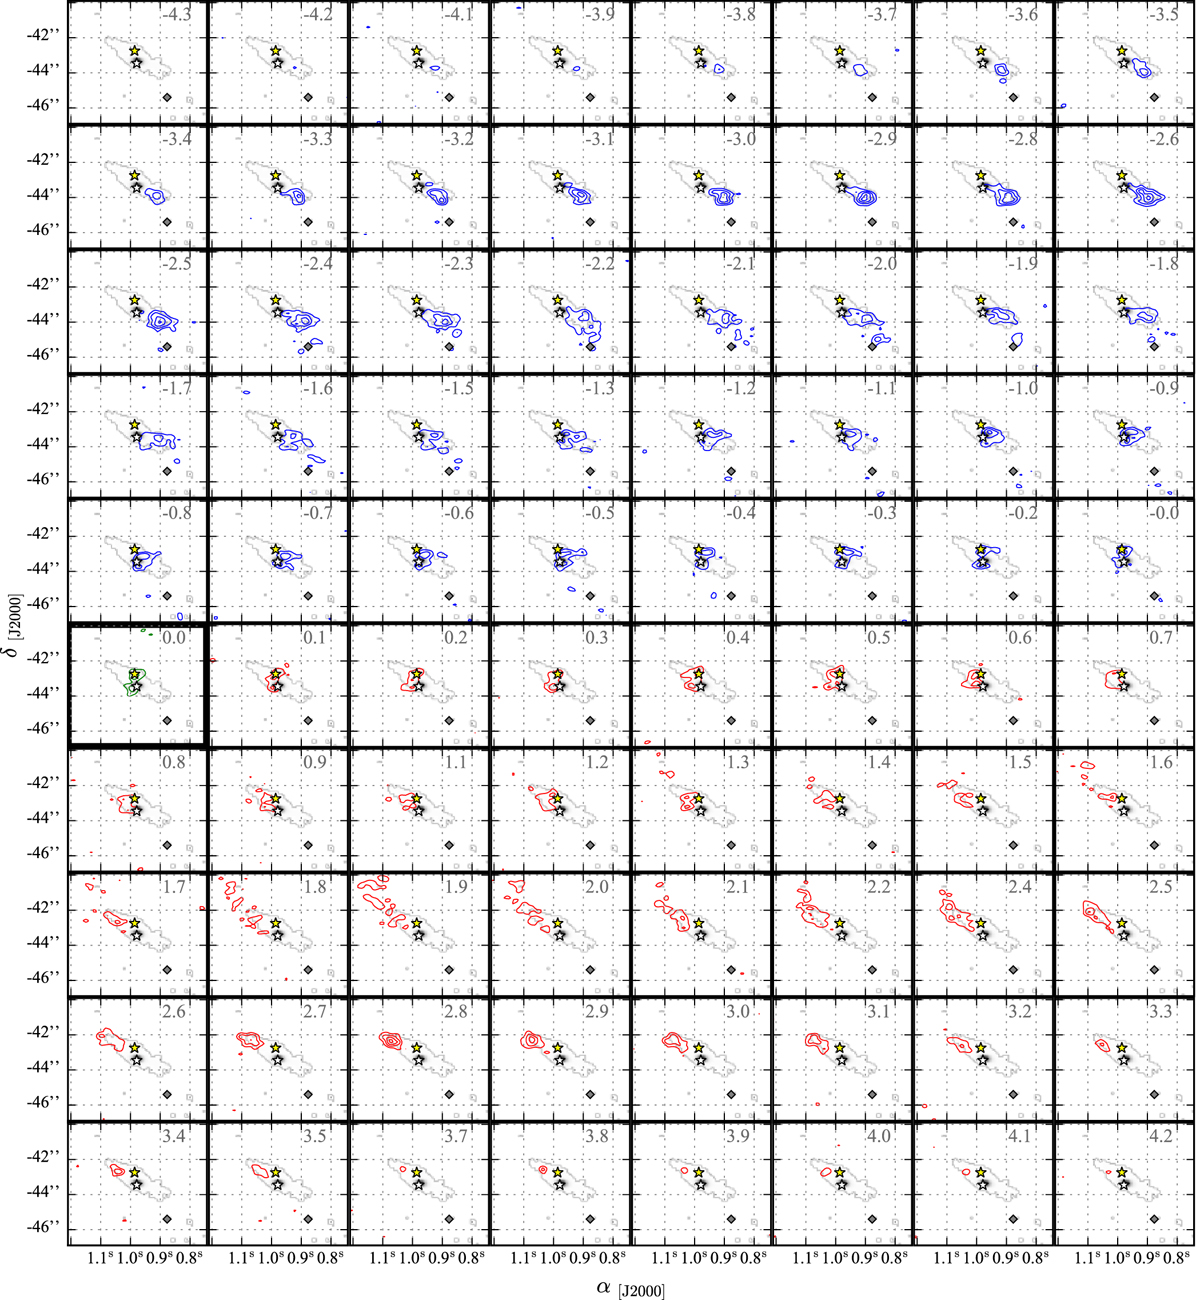
Velocity channel maps for C17O J = 3 − 2 (contours), superposed on the 0.87 mm continuum image (grey-scale; Fig. 1). The highlighted panel with green contours represents the systemic velocity of 4.2 km s−1. Blue and red contours indicate blue- and red-shifted emission with respect to the systemic velocity, respectively. In each panel, the contours start at 4σ (σ = 10 mJy beam−1 per channel), following a step of 3σ, and the mean velocity of each channel is also presented in units of km s−1. The yellow and white stars show the positions of Oph-IRS67A and B, respectively. The grey diamond denotes the location of the high-density region.
Current usage metrics show cumulative count of Article Views (full-text article views including HTML views, PDF and ePub downloads, according to the available data) and Abstracts Views on Vision4Press platform.
Data correspond to usage on the plateform after 2015. The current usage metrics is available 48-96 hours after online publication and is updated daily on week days.
Initial download of the metrics may take a while.