Fig. 11
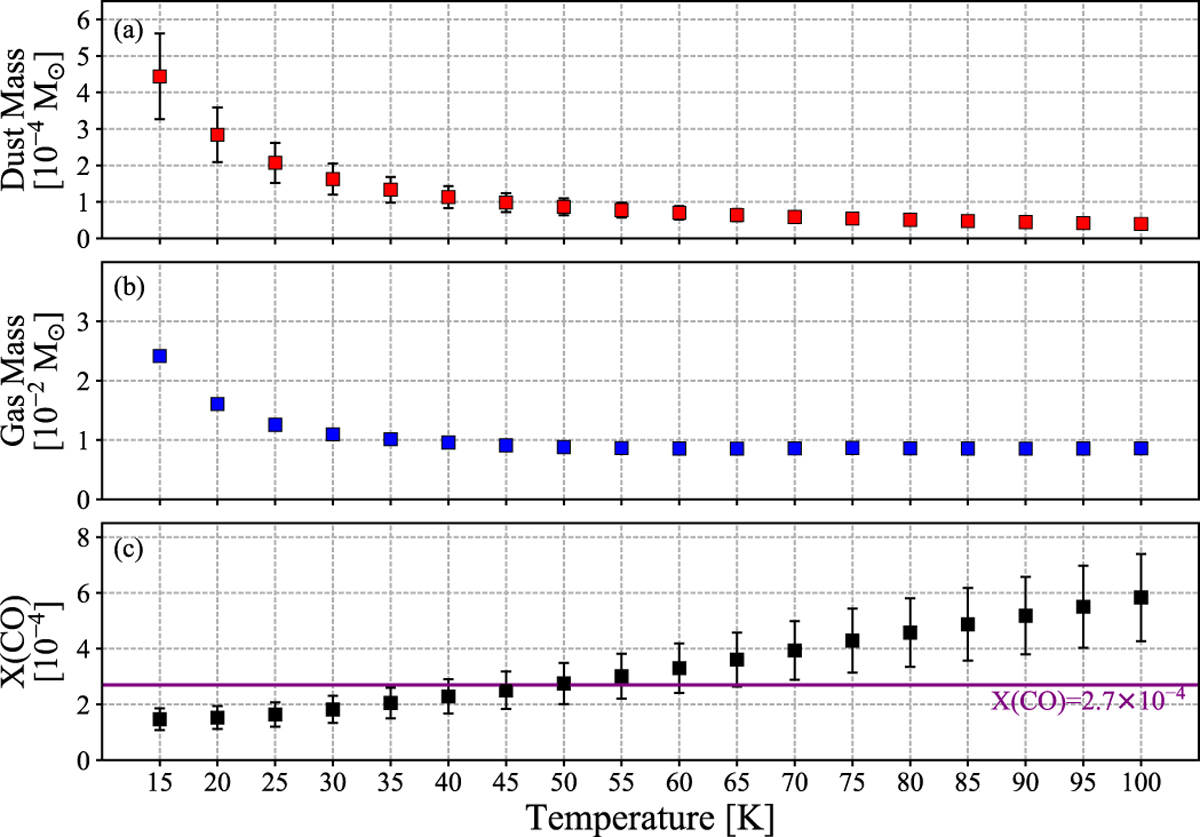
Dust mass, gas mass, and values of CO abundances, for different temperatures and taken for the entire system (both sources and the circumbinary disk). The CO abundances are calculated by assuming a gas-to-dust ratio of 100. For gas masses (blue squares), the uncertainties are ~0.3 % of the value and are imperceptible on the plot. The purple horizontal line shows the value of 2.7 × 10⁻⁴ for the abundance of CO with respect to H2.
Current usage metrics show cumulative count of Article Views (full-text article views including HTML views, PDF and ePub downloads, according to the available data) and Abstracts Views on Vision4Press platform.
Data correspond to usage on the plateform after 2015. The current usage metrics is available 48-96 hours after online publication and is updated daily on week days.
Initial download of the metrics may take a while.