Fig. 1
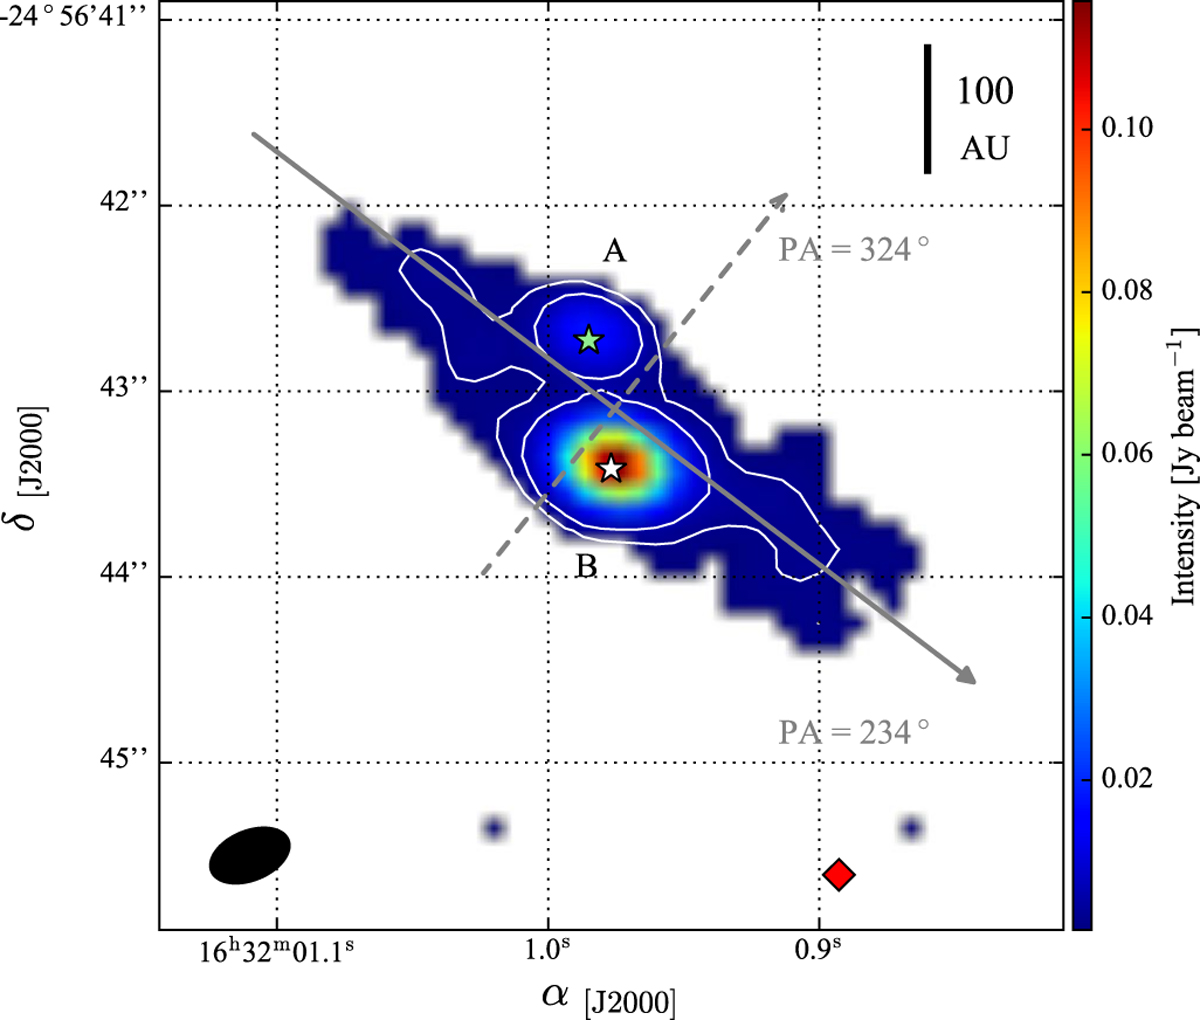
Continuum emission above 4σ (σ = 0.4 mJy beam−1) in colour scale and specific values of 7 and 15σ in white contours. The synthesised beam is represented by the black filled ellipse. The grey solid and dashed arrows cross at the geometric centre and they represent the direction of and perpendicular to the disk-like structure, respectively. The green and white stars show the positions of Oph-IRS67A and Oph-IRS67B, respectively. The red diamond denotes the location of the offset region.
Current usage metrics show cumulative count of Article Views (full-text article views including HTML views, PDF and ePub downloads, according to the available data) and Abstracts Views on Vision4Press platform.
Data correspond to usage on the plateform after 2015. The current usage metrics is available 48-96 hours after online publication and is updated daily on week days.
Initial download of the metrics may take a while.