Fig. 9
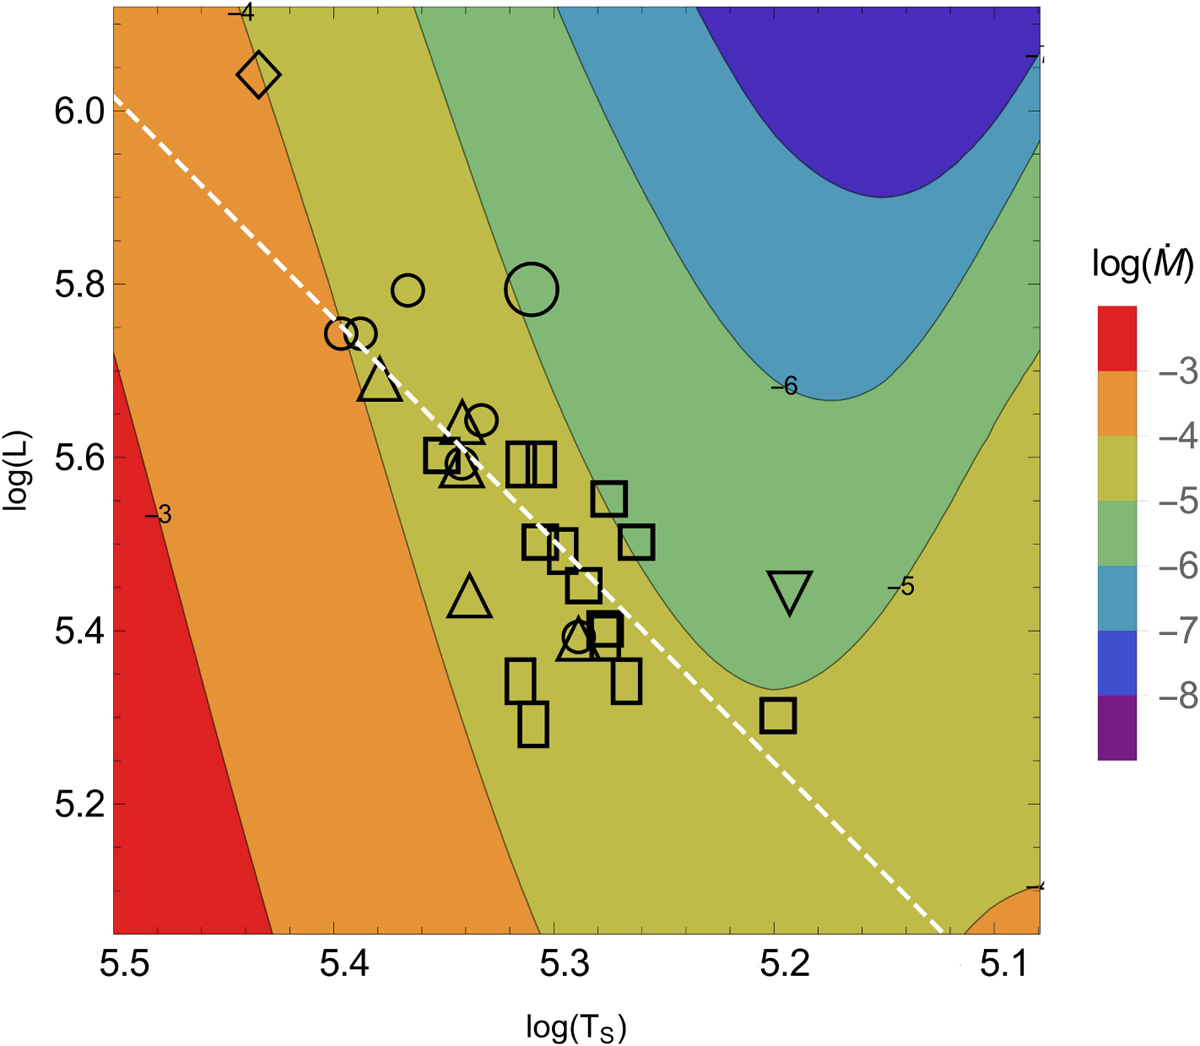
Sonic HR diagram relating the luminosity (in L⊙ ) to the sonic point temperature (in K). The background is colour-coded according to the mass-loss rates by stellar wind (legend on the right, in units of M⊙ yr −1) predicted via the use of the OPAL opacity tables and the proximity of the sonic point to the Eddington limit (see Fig. 6). The black symbols are observed Galactic WNE stars from Hamann et al. (2006), located in this diagram viatheir observed luminosity and mass-loss rates and with symbols indicating their spectral subclass, as in Fig. 8. The white dashed line is the best fitting linear relation for the observed WNE stars.
Current usage metrics show cumulative count of Article Views (full-text article views including HTML views, PDF and ePub downloads, according to the available data) and Abstracts Views on Vision4Press platform.
Data correspond to usage on the plateform after 2015. The current usage metrics is available 48-96 hours after online publication and is updated daily on week days.
Initial download of the metrics may take a while.