Fig. 5
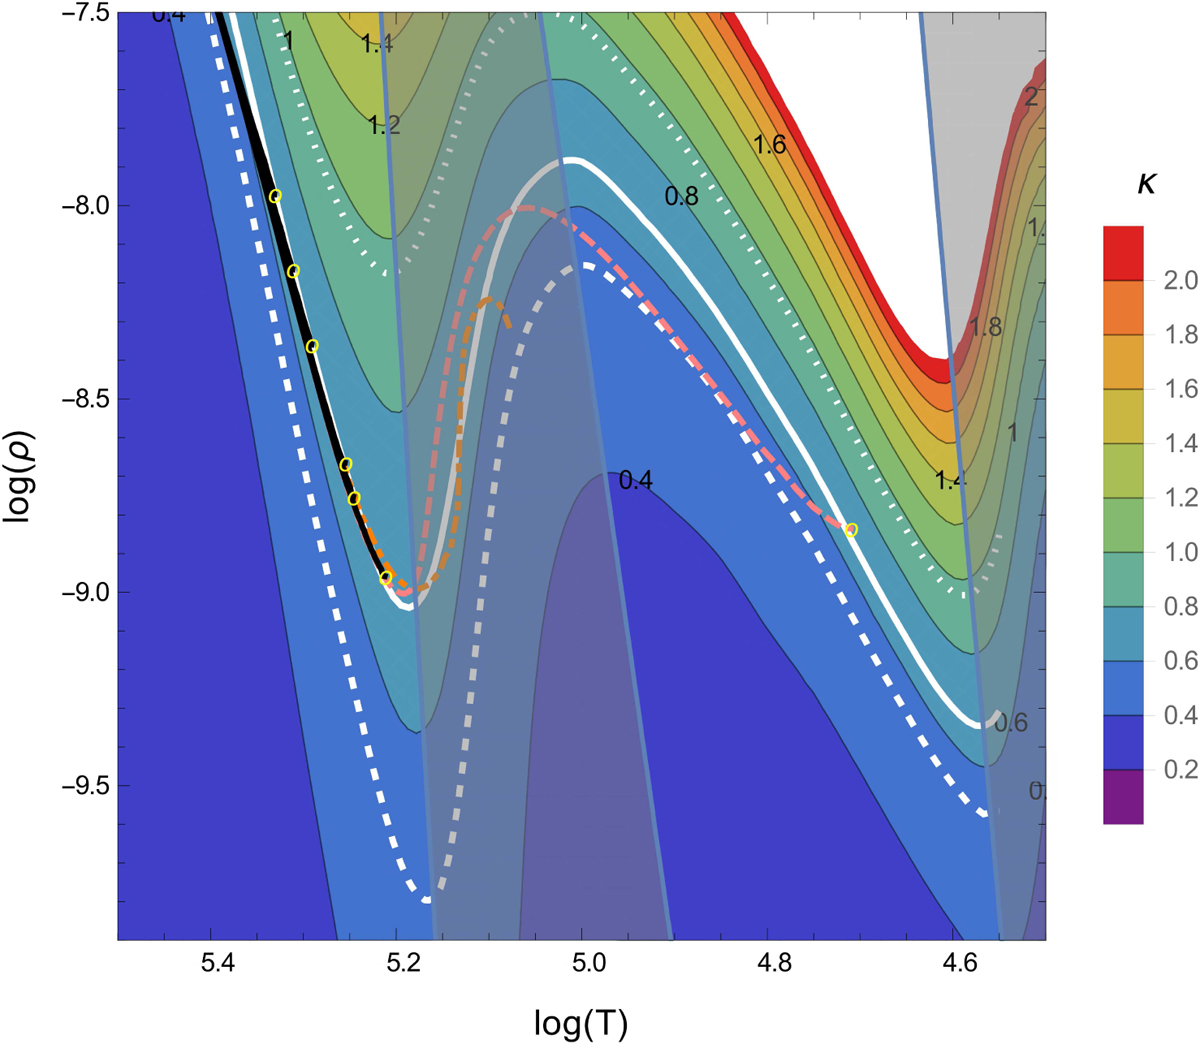
Contour plot showing the opacity (in cm2 g−2 ) from OPAL tables (colour-coded, see scale at right) as a function of temperature (in K) and of density (in g cm−3 ) for a chemical composition of [X, Y, Z] = [0, 0.98, 0.02], with X hydrogen mass fraction, Y helium mass fraction, and Z metallicity. The black lines correspond to the outer layers of the hot, more compact 15 M⊙ stellar models with Ṁ ≥ 8 × 10⁻⁶ M⊙ yr−1 from Fig. 1 (see also Table 1), while the pink line indicates the cooler model with Ṁ = 4 × 10⁻⁶ M⊙ yr−1, and the orange dot-dashed line the plane parallel grey atmosphere model with Ṁ = ×10−5 M⊙ yr−1. The yellow circles indicate the locations of the sonic points of this set of models, while the white lines indicate the iso-contours of the Eddington opacity for the 10 M⊙ (dotted), 15 M⊙ (continuous), and 20 M⊙ (dashed) stellar models. Grey areas indicate regions in the log(ρ) − log(T) diagramwhere the sonic point of a radiation-driven wind cannot be located (d κ∕d r ≤ 0).
Current usage metrics show cumulative count of Article Views (full-text article views including HTML views, PDF and ePub downloads, according to the available data) and Abstracts Views on Vision4Press platform.
Data correspond to usage on the plateform after 2015. The current usage metrics is available 48-96 hours after online publication and is updated daily on week days.
Initial download of the metrics may take a while.