Fig. 2
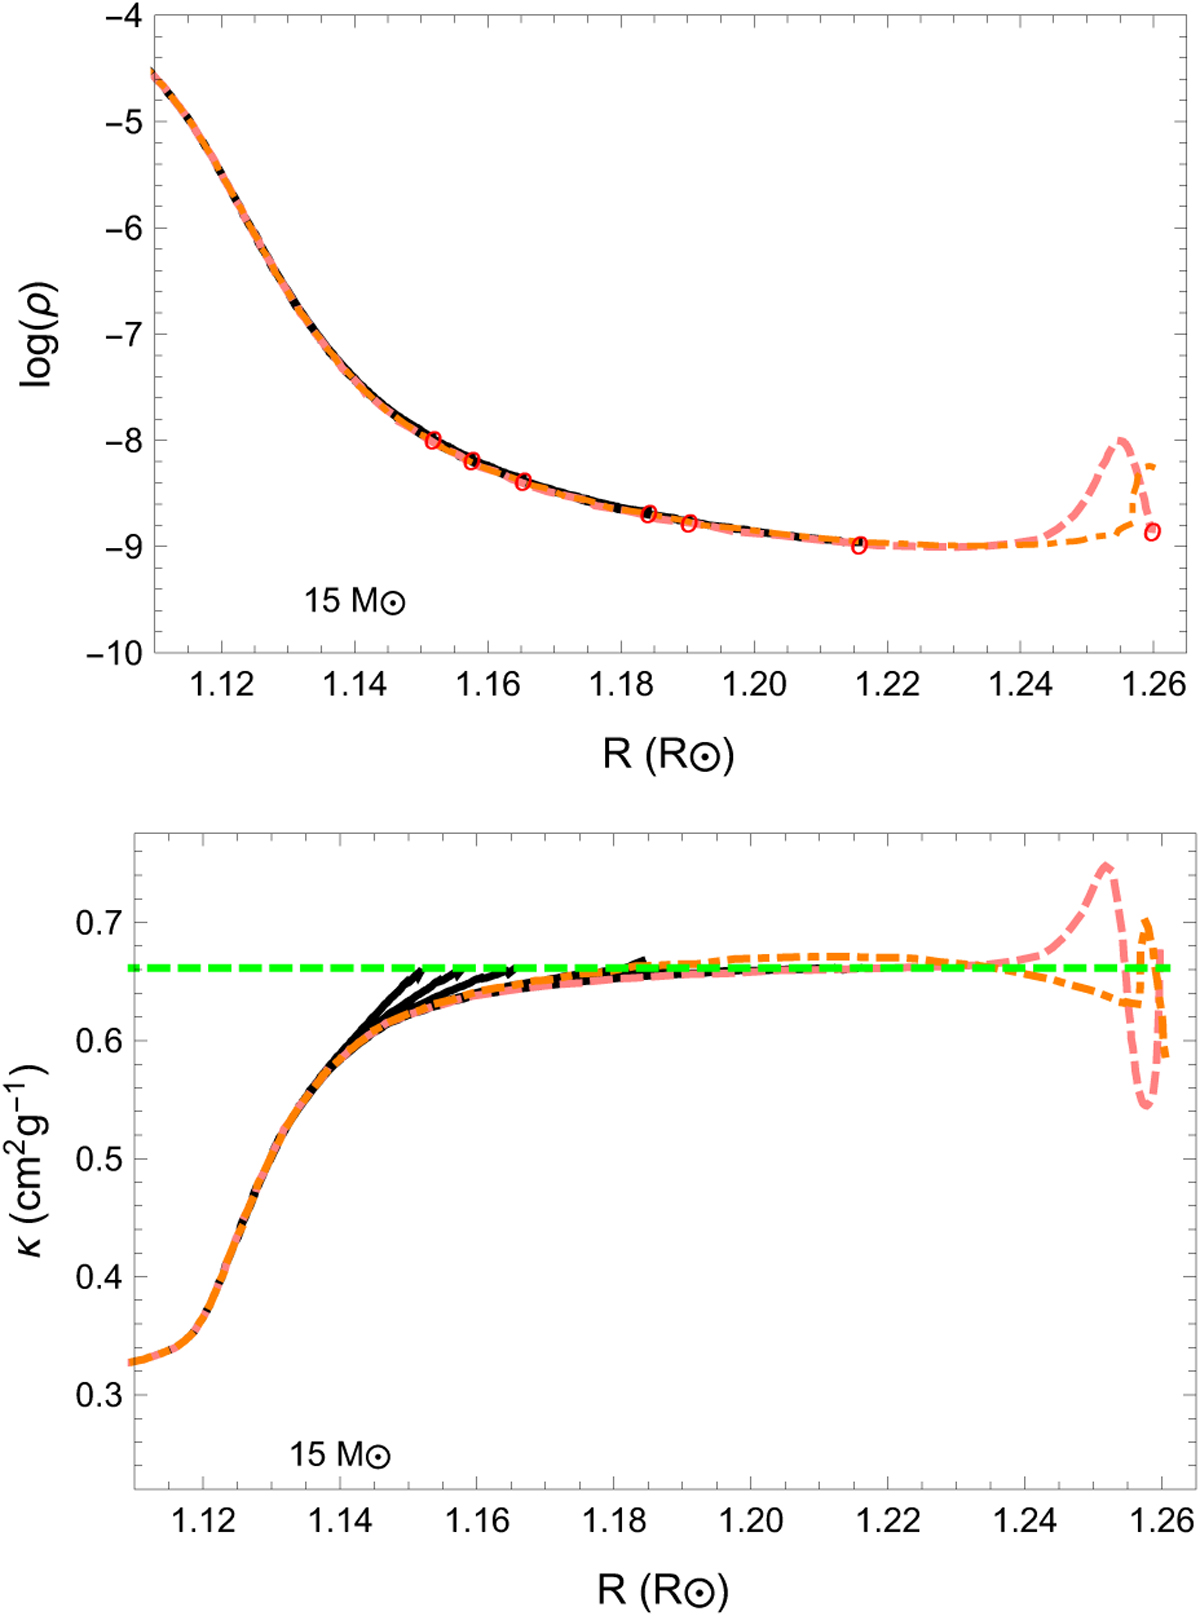
Density profile (top, in units of g cm−3) and opacity profile (bottom, in units of cm2 g−1) as a functionof radius for the same 15 M⊙ stellar models with different mass-loss rates and boundary conditions as in Fig. 1. The colours are as in Fig. 1, and the red circles indicate the location of the sonic point and the green dashed line the Eddington opacity (as defined in Eq. (24) in Sect. 4) of the pink dashed model.
Current usage metrics show cumulative count of Article Views (full-text article views including HTML views, PDF and ePub downloads, according to the available data) and Abstracts Views on Vision4Press platform.
Data correspond to usage on the plateform after 2015. The current usage metrics is available 48-96 hours after online publication and is updated daily on week days.
Initial download of the metrics may take a while.