Fig. 1
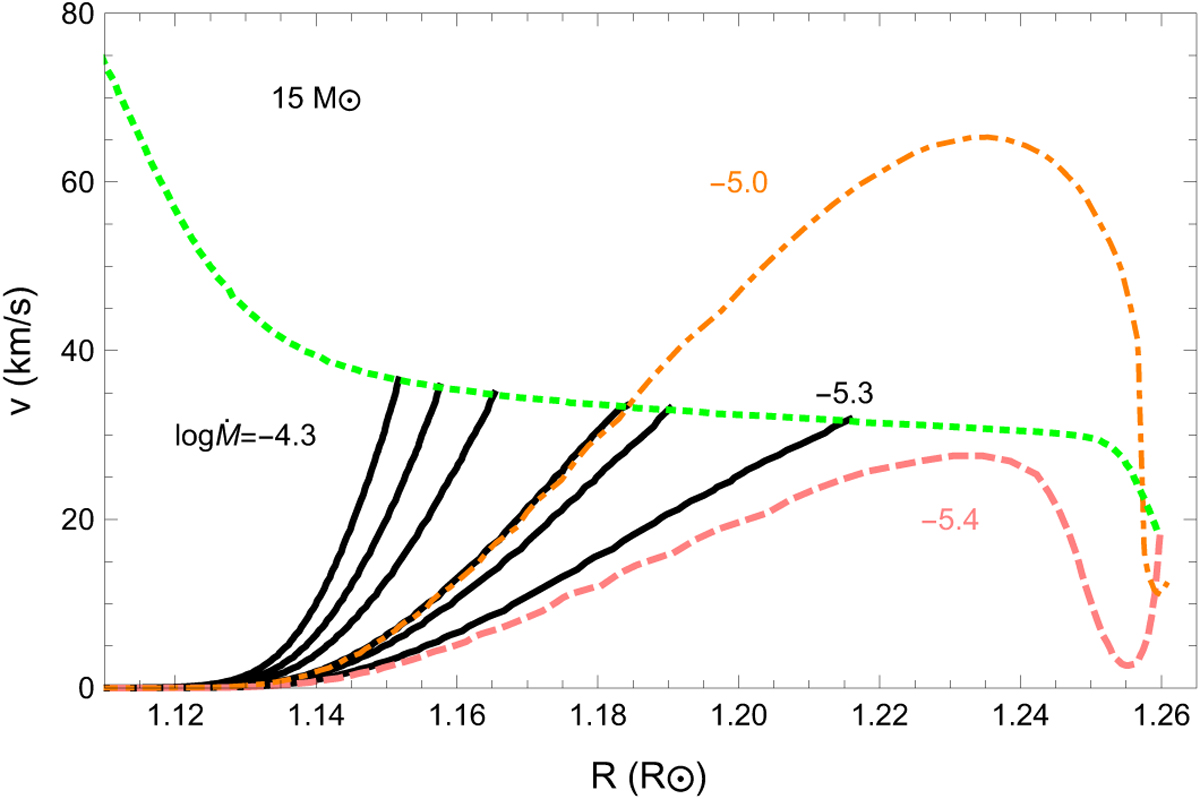
Velocity as a function of radius for a set of 15 M⊙ stellar models with different mass-loss rates and boundary conditions. The black continuous lines (from right to left) indicate models with Ṁ equal to 5, 8,10, 20, 30, 50 × 10−6 M⊙ yr−1 and the pink dashed line indicates the model with Ṁ = 4 × 10⁻⁶ M⊙ yr−1, all having sonic point boundary conditions. The orange dot-dashed lines indicates the model with Ṁ = 1 × 10⁻⁵ M⊙ yr−1 computed with plane parallel grey atmosphere boundary conditions. The green dashed line indicates the local isothermal sound speedfrom the pink dashed model.
Current usage metrics show cumulative count of Article Views (full-text article views including HTML views, PDF and ePub downloads, according to the available data) and Abstracts Views on Vision4Press platform.
Data correspond to usage on the plateform after 2015. The current usage metrics is available 48-96 hours after online publication and is updated daily on week days.
Initial download of the metrics may take a while.