Fig. 1
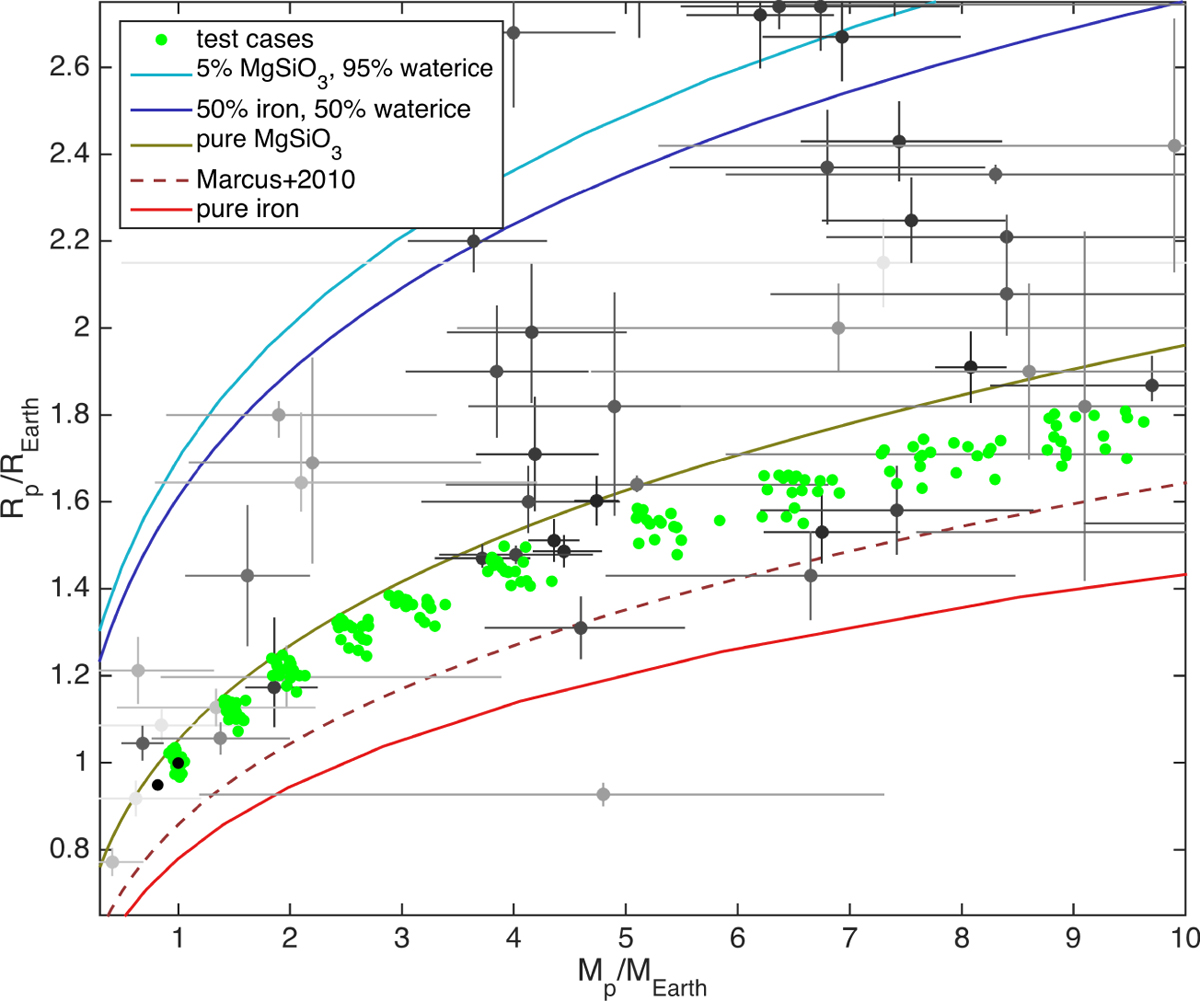
Mass-radius diagram for planets below 2.7 R⊕ and 10 M⊕ (180 Super-Earths shown). Transparencies of the black points scale with the relative error on planet mass. Green dots represent synthetic planets used in our study. The dashed curve denotes the minimum radius predicted for maximum mantle stripping due to giant impacts (Marcus et al. 2010).
Current usage metrics show cumulative count of Article Views (full-text article views including HTML views, PDF and ePub downloads, according to the available data) and Abstracts Views on Vision4Press platform.
Data correspond to usage on the plateform after 2015. The current usage metrics is available 48-96 hours after online publication and is updated daily on week days.
Initial download of the metrics may take a while.